The market next week: Sumeet Bagadia’s 3 Stock Recommendations
In the week ending July 7, the Indian market continued its record-breaking streak, driven by foreign institutional investor (FII) buying, progress in the monsoon season, and expectations of positive Q1 earnings.
-The Sensex, consisting of 30 stocks, increased by 0.86% to reach 65,280.45, surpassing the 65,000 mark for the first time.
-Similarly, the Nifty, a broad-based index, rose by 0.74% to close at 19,331.80, crossing the 19,500 level.
-Throughout the week, both the Sensex and Nifty achieved new highs, touching 65,898.98 and 19,523.60, respectively.
In terms of sectors, the BSE oil & gas index rose by 4.6%, while the realty and auto indices each increased by 2%, and the FMCG index added 1.5%. The BSE large-cap, mid-cap, and small-cap indices rose by 0.7%, 0.8%, and 1.6% respectively.
The manufacturing purchasing managers’ index (PMI) expanding to 57.8 indicated strong economic activity and sustained demand, boosting confidence in the manufacturing sector’s prospects. Provisional business numbers from banks, automakers, and real estate companies also contributed to investor confidence. Additionally, the support provided by FIIs further strengthened the domestic market.
However, trade tensions between the US and China and uncertainties arising from the hawkish US Federal Reserve meeting minutes tested global investors’ risk appetite.
Related Read: Will the Nifty Reach 21,000?
Factors to Watchout Coming Week
Towards the end of the week, the market showed some signs of weariness and experienced a slight decline. Given the high market valuation, profit booking was observed at the upper band of the rally.
Market participants are now eagerly awaiting domestic and US inflation numbers to gain insights into the sustainability of the ongoing rally.
-The anticipation of a potential rate action from the US Federal Reserve in its upcoming meeting led to a slump in overseas markets.
-There are concerns that inflation may persist at higher levels, leading to a north-bound trajectory in interest rates, which could cause short-term turbulence.
Considering the market dynamics and the analysis provided by Sumeet Bagadia, Executive Director at Choice Broking, here is a trading strategy for the stock market next week:
Resistance and Support Levels:
The Nifty is currently facing resistance at 19,500, and breaching this level is essential for further upside potential. On the downside, the Nifty has immediate support at 19,250. Pay close attention to how the index behaves around these levels.
Bank Nifty Sell-off Pressure:
The Bank Nifty has lost the crucial psychological level of 45,000, indicating the possibility of further selling pressure. Monitor the Bank Nifty closely as it may continue to face downward pressure.
As the Nifty faces resistance at 19,500, wait for confirmation of a bullish breakout above this level before considering long positions. Look for stocks that exhibit strength and positive technical indicators. Monitor the Bank Nifty for signs of stabilization or a potential rebound before considering buying opportunities in the banking sector.
Remember, these strategies are based on the provided information and general market analysis. Conduct your own research, assess your risk tolerance, and consider seeking advice from a financial advisor or broker for personalized guidance tailored to your specific investment goals.
Also Read:Biggest Positive Development in Tata Power
Here are the stock recommendations provided by Sumeet Bagadia for next week:
Related Read: Tata Technologies IPO – Unlisted Share Price, Company, Business, Rally in Tata Motors: All You Need to Know
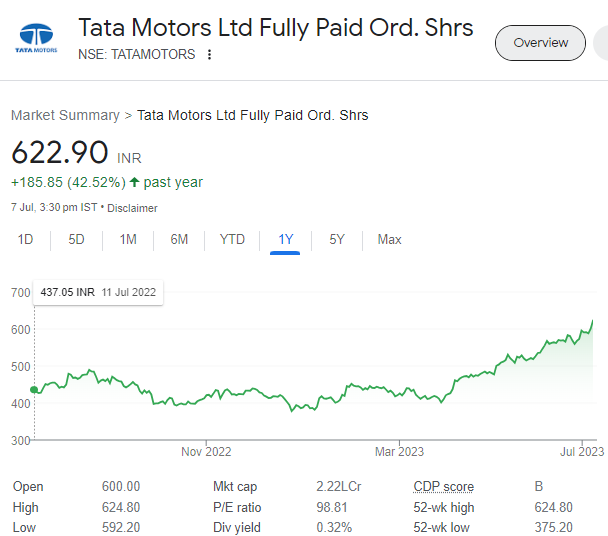
Tata Motors:
The Technical
-Tata Motors has formed a higher high higher low pattern on the charts, indicating a positive trend.
-The stock is trading at all-time high levels and is currently moving above all important moving averages, signaling continued upward momentum.
-Strong volumes support the recent price increase, indicating strength in the stock.
-Any potential dips can be viewed as buying opportunities.
-On a weekly timeframe, the stock has given a breakout of an inverted head and shoulder pattern, further confirming the bullishness.
Company Info:
- Tata Motors is a renowned Indian multinational automotive manufacturing company.
- The company is a part of the Tata Group conglomerate, one of the largest business conglomerates in India.
Promoters:
- Tata Motors is primarily promoted by Tata Sons, the principal investment holding company of the Tata Group.
- The Tata Group is known for its diverse business interests across various industries.
Business:
- Tata Motors operates in the automotive sector, engaged in the design, development, manufacturing, and sale of a wide range of vehicles.
- The company produces a diverse portfolio of vehicles, including passenger cars, commercial vehicles, electric vehicles, and utility vehicles.
Products:
- Tata Motors offers a wide range of products across different segments and categories.
- The company’s popular passenger car models include the Tata Tiago, Tata Altroz, Tata Nexon, and Tata Harrier.
- In the commercial vehicle segment, Tata Motors produces trucks, buses, and vans that cater to both domestic and international markets.
Innovation and Sustainability:
- Tata Motors has been at the forefront of innovation and sustainability initiatives in the automotive industry.
- The company has been actively developing electric and hybrid vehicle technologies to promote cleaner and greener mobility solutions.
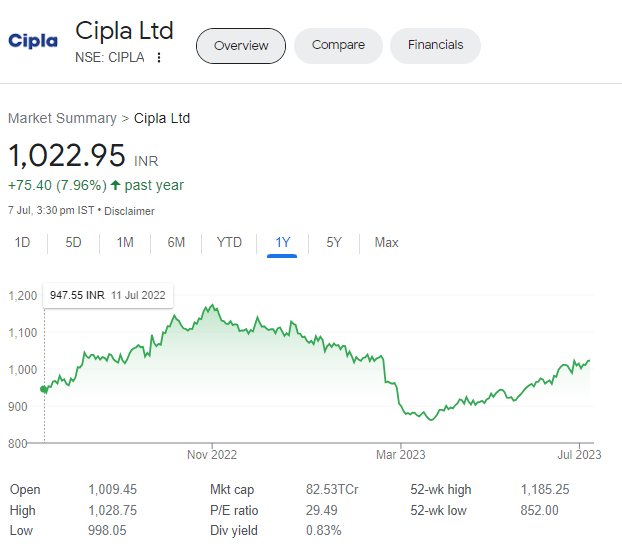
Cipla:
- Buy at Rs 1021
- Target: Rs 1060
- Stop loss: Rs 1000
The Technical
-Cipla recently retested a crucial support level of Rs 1000, which also coincides with the 20-day exponential moving average (EMA).
-The stock’s nearest resistance level is around Rs 1030. If it breaks above this barrier, it has the potential to increase towards the target range of Rs 1060.
-The Relative Strength Index (RSI) indicator is currently trading at 63, supporting the stock’s upward movement.
-Cipla is trading above all important moving averages, indicating positive momentum.
-The stock has also rebounded from the middle band of the Bollinger Bands and is heading toward the upper band.
- Cipla is a leading Indian pharmaceutical company with a strong presence in both domestic and international markets.
- The company was founded in 1935 and has emerged as a key player in the pharmaceutical industry, offering a diverse range of high-quality medicines and healthcare products.
Promoters:
- Cipla’s promoters include various entities and individuals, including the founding families, institutional investors, and individual shareholders.
Business:
- Cipla operates in the pharmaceutical sector, focusing on the development, manufacturing, and marketing of a wide range of pharmaceutical products.
- The company has a strong portfolio of prescription drugs, over-the-counter medications, active pharmaceutical ingredients (APIs), and innovative therapies across various therapeutic areas.
Products:
- Cipla offers a broad spectrum of products, including drugs for respiratory disorders, cardiovascular diseases, central nervous system disorders, anti-infectives, and oncology treatments.
- The company is also known for its expertise in producing affordable generic medicines, contributing to accessible healthcare solutions worldwide.
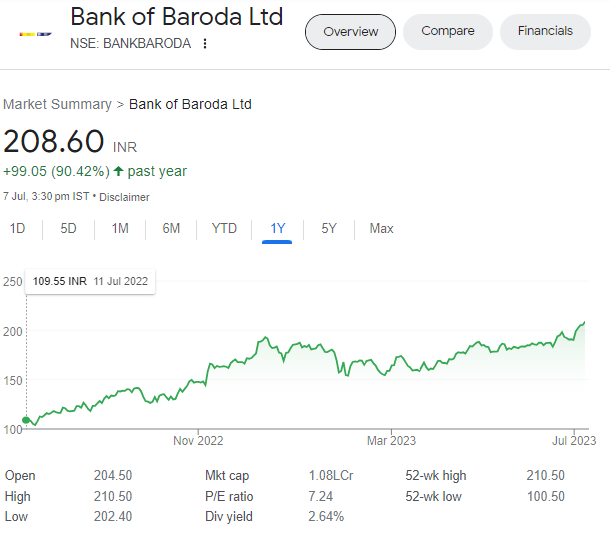
- Buy range: Rs 205
- Target: Rs 225
- Stop loss: Rs 202
- Bank of Baroda is one of the leading public sector banks in India with a long-standing history dating back to 1908.
- The bank offers a wide range of banking and financial services, including retail banking, corporate banking, treasury operations, wealth management, and international banking.
- Bank of Baroda is primarily promoted by the Government of India, which holds a significant stake in the bank.
- In addition to the government, various financial institutions and entities also act as promoters of Bank of Baroda.
- Bank of Baroda operates in the banking sector, providing a comprehensive range of services to individual customers, businesses, and corporates.
- The bank caters to diverse customer needs through its various divisions, including retail banking, corporate banking, treasury operations, and wealth management.
- Bank of Baroda offers a wide array of products and services, including savings accounts, current accounts, loans, mortgages, credit cards, insurance, investment products, and trade finance solutions.
- The bank also provides specialized services such as foreign exchange, wealth management, and digital banking solutions to enhance customer experience and meet evolving banking requirements.

Bank of Baroda:
The Technical
-The stock of Bank of Baroda has shown a breakout of a cup and handle pattern in the daily chart, indicating strength.-It is trading above the 21-day moving average.
-There might be some minor resistance around Rs 212 to Rs 213 levels.
-The Relative Strength Index (RSI) indicator is at a comfortable level of 60, indicating strength.
-On the daily charts, there is a Bollinger Band squeeze, with the stock trading above the middle line, which further indicates strength.
-It is advisable to enter the stock in the range of Rs 205 to Rs 206 for a safer entry. Maintain a stop loss at Rs 202.
Company Info:
Promoters:
Business:
Products:
Please note that we are not SEBI-registered advisors or analysts. All the views shared in this article and all the content shared on aceink.com are only for learning and educational purposes. Any part of the article or any information on Aceink.com should not be interpreted or considered as investment advice. None of the opinions, views, or content posted on Aceink.com constitutes investment advice, as we are not SEBI-registered advisors or analysts.
DISCLAIMER:
We are not SEBI-registered advisors or analysts. All the views shared in this article and all the content shared on aceink.com are only for learning and educational purposes. Any part of the article or any information on Aceink.com should not be interpreted or considered as investment advice. None of the opinions, views, or content posted on Aceink.com constitutes investment advice, as we are not SEBI-registered advisors or analysts.
Aceink.com or any person associated with this website accepts no liability or responsibility for any direct, indirect, implied, or any other consequential damages arising directly or indirectly due to any action taken based on the information provided on this website. Please conduct your own research, and we suggest seeking investment advice only from a SEBI-registered investment advisor.
The views expressed by investment experts, broking houses, news and media houses, rating agencies, etc., are their own and not those of Aceink.com or its management. Aceink.com advises users to consult a SEBI-registered investment advisor before making any decisions.
——————-
“Why the Thriving entertainment Industry Should Be on Your Investment Radar” Visualize the glistening waters of Goa, India’s…Read More“Discovering Hidden Gems: The Investment Potential of the Gaming Stock”