Everyone keeps talking about making more money in the stock market. But how can you do it? To do this, you will need to understand the stock market inside and out. Now the question is, from where to start? The answer is to start with Candlestick Patterns.
They form the base for reading charts. Every trader who takes the work seriously, whether just starting out or already experienced, uses them to figure out what the market is really up to.
Here’s what most people overlook:
Candlesticks show more than just shapes on a screen. They represent actual buying and selling pressure taking place at that moment.
Once you get them, charts no longer look like noise. They begin to tell a clear story.
What Are Candlestick Patterns?
Candlestick patterns are the shapes you see on stock charts that display how the price behaved during a set time frame.
Each candle shows you:
- Opening price
- Closing price
- Highest price
- Lowest price
But the real value comes from this: Which side holds the power — buyers or sellers. That is why Candlestick Patterns carry real weight. They let you pick up on the mood of the market.
Structure of a Candlestick
Every candlestick consists of two basic sections:
1. Body
The wider section of the candle
- Green → Price ended higher (buyers held the edge)
- Red → Price ended lower (sellers held the edge)
2. Wick (Shadow)
The thin lines that stick out at the top and bottom
- Shows where price got rejected
- Marks the spots where buyers or sellers lost control
Long wicks usually point to uncertainty or possible turning points.
Why Candlestick Patterns Matter
New traders often stare at charts and only notice ups and downs that seem random.
Experienced traders spot something different:
- Places to get in
- Places to get out
- Signs the trend will keep going
- Signs the trend might turn
Candlestick Patterns offer clues ahead of the main price shift.
Most Important Candlestick Patterns
Let’s go through the main patterns that every new trader should learn.
1. Doji – Market Confusion
A Doji appears when the opening price and closing price sit almost at the same level.
Meaning: Buyers and sellers stayed balanced
What it tells you:
- The market cannot decide which way to go
- A reversal or short break may be coming
Use it best around support or resistance areas.
2. Hammer – Potential Reversal Signal
A Hammer shows a small body paired with a long lower wick.
Meaning: Sellers drove the price lower during the session, yet buyers stepped in and pushed back
What it signals:
- Chance of an upward turn
- Clear interest from buyers
It works strongest after a downtrend.
3. Shooting Star – Selling Pressure
The opposite of a hammer.
Small body with a long upper wick.
Meaning: Buyers lifted the price higher, but sellers stepped in and drove it back down
What it signals:
- Chance of a downward turn
It usually shows up at the end of an uptrend.
4. Bullish Engulfing – Strong Buying
A green candle that fully swallows the previous red candle.
Meaning: Buyers seized control in a decisive way
What it signals:
- Shift in trend toward higher prices
- Fresh strength in the move
5. Bearish Engulfing – Strong Selling
A red candle that fully swallows the previous green candle.
Meaning: Sellers seized control
What it signals:
- Chance of a downtrend
- Weakness showing up in the price
6. Morning Star – Bullish Reversal
This three-candle setup includes:
- A red candle
- A small indecision candle
- A strong green candle
Meaning: Sellers are fading and buyers are stepping forward
It points to a possible move higher.
7. Evening Star – Bearish Reversal
The opposite of the Morning Star.
Meaning: Buyers are losing ground while sellers build strength
It points to a possible move lower.
Important Rule Most Beginners Ignore
Candlestick Patterns by themselves do not tell the full story.
They deliver the best results when you combine them with:
- The overall trend
- Support and resistance
- Volume
A hammer that shows up with no context carries little value
A hammer sitting right at support carries real power
This is the part where true skill comes in.
Is There Any Webinar Where I Can Learn Candlestick Patterns Online for Free?
Yes, many free webinars are available online, such as Aceink by Bharath Shankar, a well-known SEBI-registered stock analyst. Still, many of them keep things too simple or stick mostly to theory, skipping how candlestick patterns perform when real money is on the line.
You might pick up the names of the patterns, but you will not learn how to trade them when your own capital is at risk. That missing piece trips up most new traders.
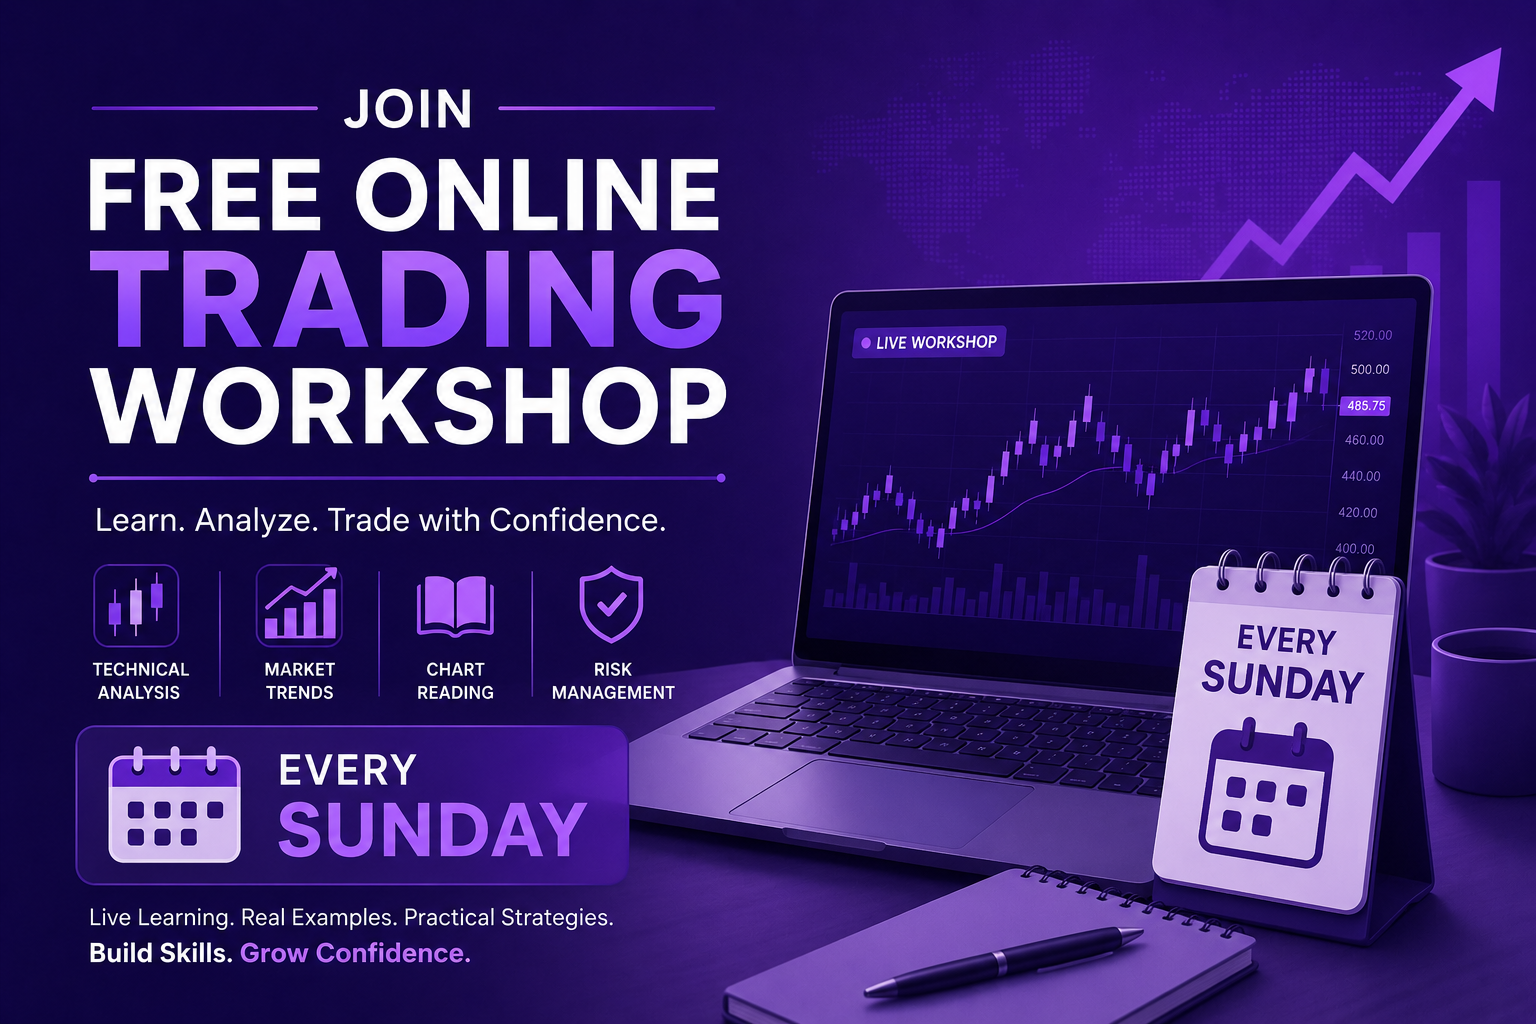
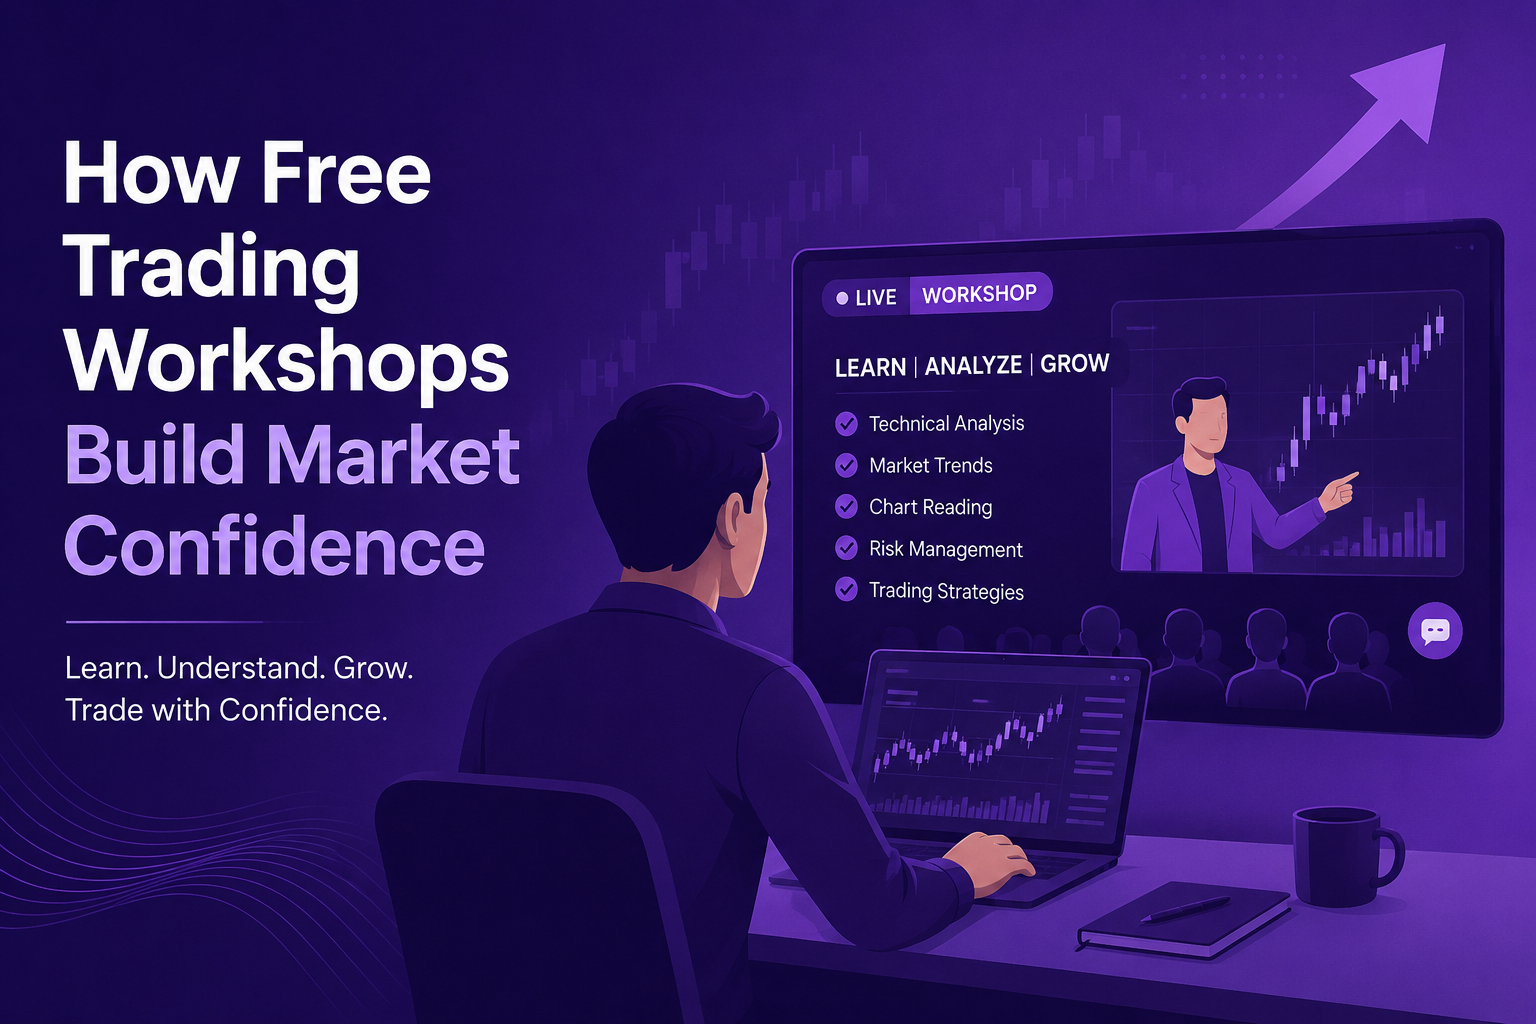
Aceink’s Free Stock Market Workshop – Practical Learning
If you really want to understand how Candlestick Patterns behave during actual trading, you need clear step-by-step guidance.
Aceink runs a free online stock market workshop designed for beginners who need straight answers rather than mixed messages.
Led by a SEBI-registered stock market analyst, the session places heavy emphasis on real-world use rather than just book-style descriptions.
During this free stock market learning workshop, you will cover:
- How to read candlestick patterns on live charts
- How to spot setups with better odds
- How to steer clear of typical beginner errors
- How to create a clear trading process
This goes beyond regular conversation. It aims to help you truly get the material and put it to work.
Who Should Join This Free Workshop?
This kind of beginner-focused stock market workshop fits well if:
- You have just started trading
- You still struggle to read stock charts
- You depend on tips more than your own analysis
- You prefer learning in an organized way
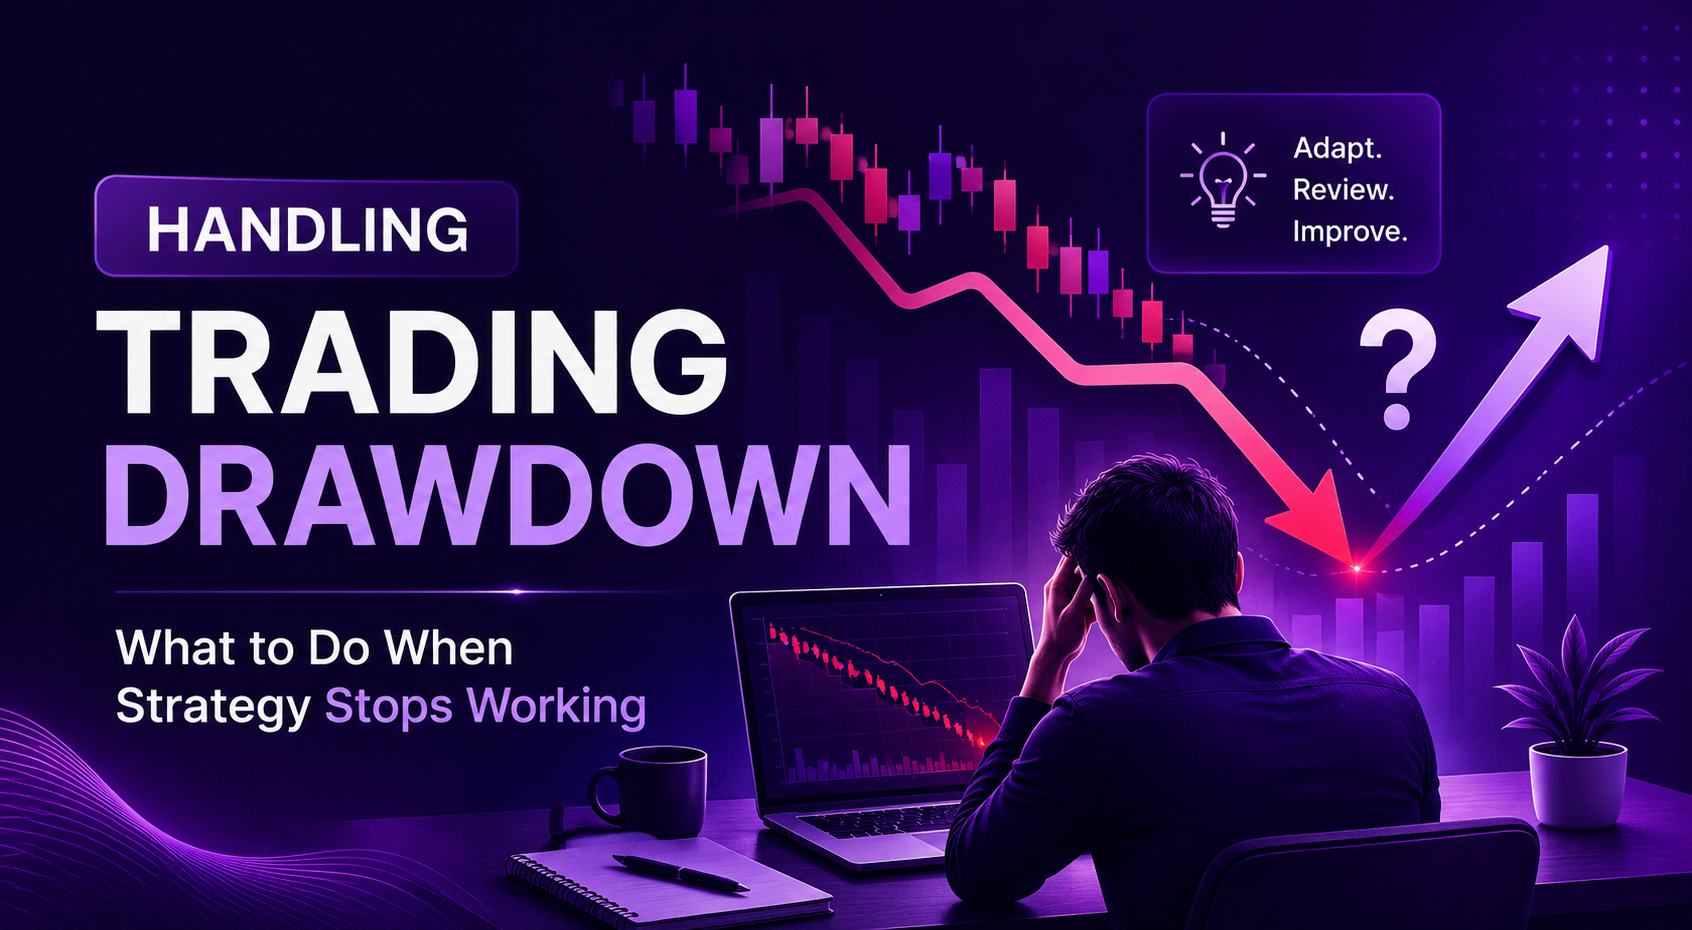
What Changes After Learning Candlestick Patterns Properly?
Once you truly understand Candlestick Patterns:
You stop:
- Making random trade choices
- Chasing outside suggestions
- Jumping into positions without reason
You start:
- Spotting what the market is signalling
- Preparing your trades ahead
- Keeping proper control over risk
That marks the move from beginner level to a more organized way of trading.
Conclusion
Candlestick Patterns rank among the strongest tools available in the stock market — provided you apply them the right way.
They let you read the psychology behind price moves, catch good chances, and reach smarter trading choices.
Still, the way you learn them makes all the difference.
Aceink, under the guidance of a SEBI-registered stock market analyst, aims to provide beginners with solid market knowledge through well-planned sessions.
Join our free online stock market workshop and find out how to put candlestick patterns to use in actual market conditions.
No quick fixes. No empty claims.
Just clear, organized learning that builds the right market insight.