Technical tools give traders an easier way to read price moves and spot market strength. From the many available indicators, the MACD (Moving Average Convergence Divergence) stands out as one of the most favoured. It is a trend-following momentum indicator that combines the direction of the trend and its strength into one indicator.
New traders often find MACD confusing in the beginning since it comes with several lines plus a histogram. Once you get how it functions, though, it turns into a useful way to catch changes in momentum, ongoing trends, and signs that a move might turn around.
The main point is to grasp exactly what the MACD shows you instead of following it without thinking. This guide lays everything out clearly step by step.
What is MACD?
The acronym for MACD is Moving Average Convergence Divergence. It’s a trend-following momentum indicator that measures the relationship between two moving averages of price.
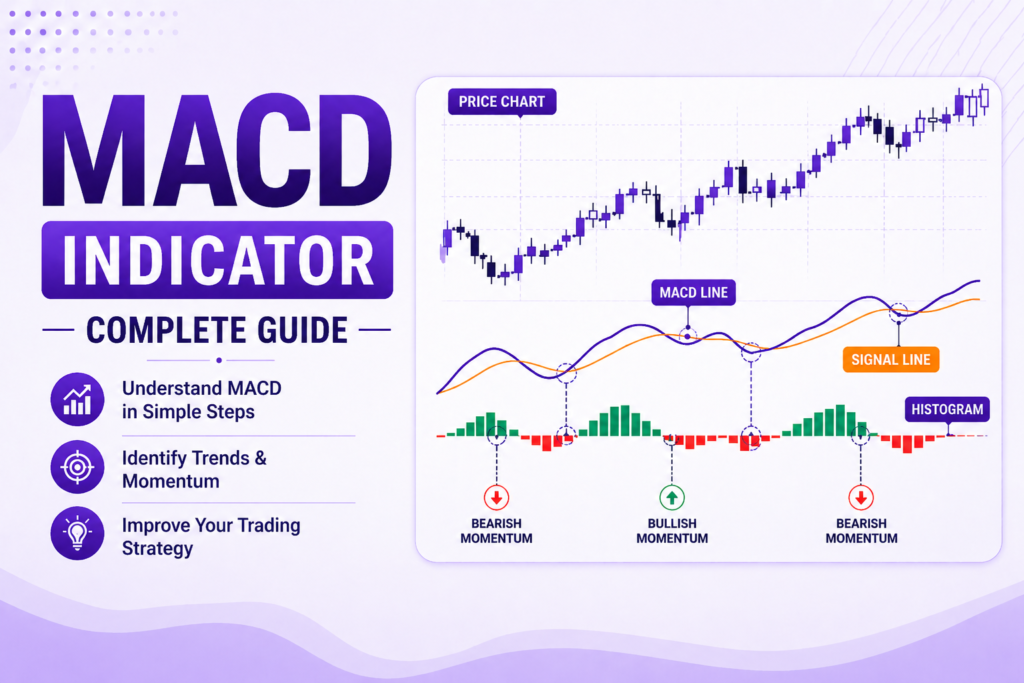
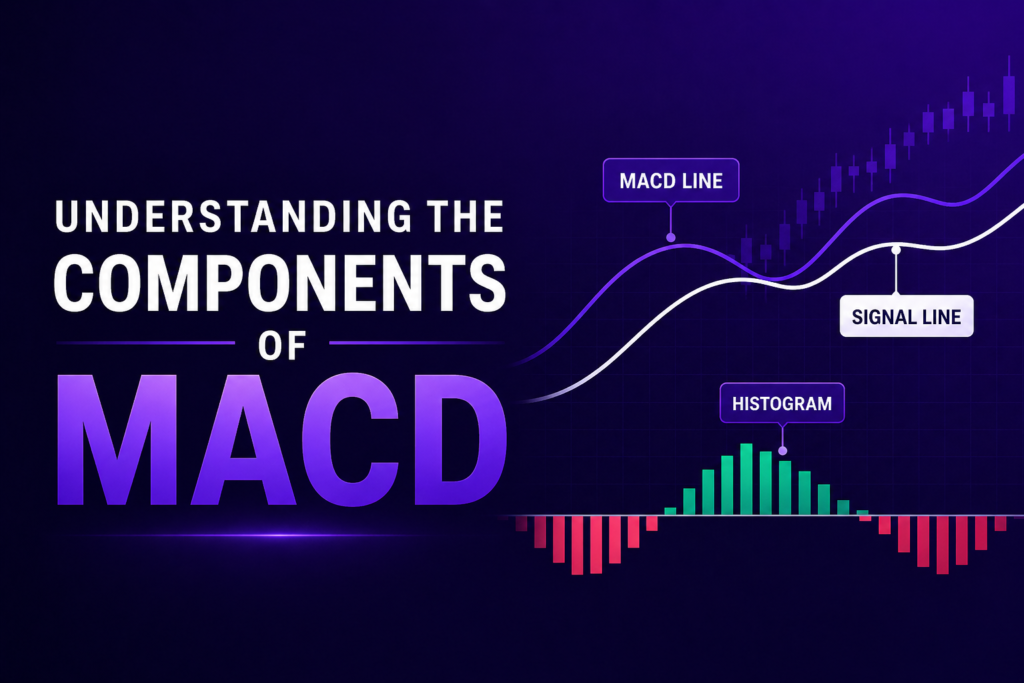
The usual MACD setup has three parts:
- MACD Line
- Signal Line
- Histogram
These pieces connect to give traders a picture of momentum and which way the trend is heading.
While tools like RSI look at whether prices have gone too far up or down, MACD pays more attention to shifts in momentum and how strong a trend feels.
Understanding the Components of MACD
You should get familiar with how MACD is built before you start using it for trades.
MACD Line
The MACD line is formed when traders subtract the 26-period Exponential Moving Average (EMA) from the 12-period Exponential Moving Average (EMA).
The line catches short-term shifts in momentum and is often the first to emit a warning that a trend might be changing.
Stronger momentum pushes the MACD line farther from the zero line. Weaker momentum pulls it back toward the zero line.
Signal Line
The signal line comes from a 9-period EMA applied to the MACD line itself.
It smooths the MACD line and generates clear crossover points.
Traders use this line as a guide when deciding when to enter or leave a position.
Histogram
The histogram simply measures the gap between the MACD line and the signal line.
It gives a quick visual read on how strong momentum has become.
When the bars grow taller, momentum is picking up speed. When the bars get smaller, momentum is losing power.
How MACD Works
MACD tracks the gap that opens up between short-term momentum and longer-term momentum.
If short-term momentum starts growing faster than the longer-term side, the MACD points to bullish power. If short-term momentum starts fading compared with the longer view, the MACD points to bearish pressure.
Because of this, MACD does a good job spotting both the direction of a trend and any changes in its energy.
MACD Crossover Strategy
The crossover stands out as one of the simplest and most used MACD approaches.
Bullish Crossover
A bullish crossover takes place when the MACD line moves above the signal line.
It shows that short-term momentum is getting stronger and buyers could be taking charge.
Traders often treat this as an early sign to buy, particularly when the bigger trend lines up in the same direction.
Bearish Crossover
A bearish crossover occurs when the MACD line drops below the signal line.
This points to fading momentum and rising pressure from sellers.
Many use it as a cue to close long trades or start looking for chances to sell short.
Zero Line Concept in MACD
The zero line plays a key role when reading MACD.
MACD staying above zero signals bullish conditions because short-term momentum beats the longer-term pace.
MACD staying below zero signals bearish conditions because short-term momentum falls behind.
The zero line lets traders see the larger trend picture instead of getting stuck only on the crossovers.
MACD Histogram Strategy
Beginners sometimes overlook the histogram, yet it offers useful early hints.
Growing histogram bars show momentum gaining ground. Shrinking bars show momentum starting to fade.
These changes can warn you before any actual crossover appears.
For example:
- Rising histogram during an uptrend means the move is getting stronger
- Shrinking histogram during an uptrend hints at a possible pullback or loss of power
This feature makes the histogram handy for deciding exact timing.
MACD Divergence Strategy
Divergence counts as one of the most powerful ideas within MACD.
Bullish Divergence
Bullish divergence appears when price forms a lower low while MACD forms a higher low.
It tells you that downward pressure is easing off and a turnaround could be near.
Bearish Divergence
Bearish divergence shows up when price forms a higher high while MACD forms a lower high.
It suggests that upward pressure is running out of steam and price might start heading lower.
Always wait for price action to confirm any divergence before you enter a trade.
Best Way to Use MACD in Trading
MACD delivers better results when you pair it with the overall market layout.
A solid method looks like this:
- Start by pinning down the main trend
- Check MACD crossovers to confirm momentum
- Rely on support and resistance levels for entry areas
- Let price action give the final okay
Putting these pieces together raises the quality of your trade ideas.
Common Mistakes While Using MACD
Plenty of traders get MACD wrong because they lean on it by itself.
Typical errors include:
- Jumping on every crossover without looking at the trend
- Skipping the bigger market picture
- Trying to trade when the market moves sideways
- Entering trades without waiting for price confirmation
- Getting in too late once the crossover has already happened
MACD gives the best help when it backs up your overall analysis rather than standing in for it.
When MACD Works Best
MACD shines brightest inside clear trending markets where momentum changes stand out.
It proves especially useful for:
- Swing trading
- Following established trends
- Entering on pullbacks
- Spotting reversals through divergence
In choppy, sideways markets, MACD tends to create misleading signals since price has no real direction.
MACD vs RSI: What’s the Difference?
Both tools look at momentum, but they do it in separate ways.
RSI pays attention to the strength of momentum and whether conditions have become overbought or oversold.
MACD watches for shifts in momentum and signals that follow the trend.
Many traders run both at the same time to get a clearer overall view.
Why MACD is Important in Stock Market Learning
MACD lets traders see momentum in a clear, organized manner. It shows how trends start building, lose speed, and sometimes turn the other way.
This makes MACD a valuable piece of structured stock market learning, especially for people who want a deeper feel for how markets actually behave.
Learn MACD with Practical Understanding
Grasping the idea behind MACD comes fairly easy, but using it well in real trading takes real practice and solid direction.
Aceink, run by SEBI Registered Stock Market Analyst Bharath Shankar, guides traders toward hands-on knowledge through its Free Stock Market Webinar. During the session, participants see exactly how MACD acts in live markets, how to blend it with price action, and how to steer clear of typical errors.
This real-world method builds real confidence and understanding.
Conclusion
MACD ranks as one of the most useful momentum indicators since it helps traders read trend direction, spot momentum changes, and catch possible reversals.
Still, no indicator should stand alone. The strongest outcomes appear when you combine MACD with trend checks, support and resistance levels, and clear price action.
Aceink supports traders in developing this skill set through its Free Stock Market Webinar, where technical ideas get explained using actual market examples and step-by-step learning.