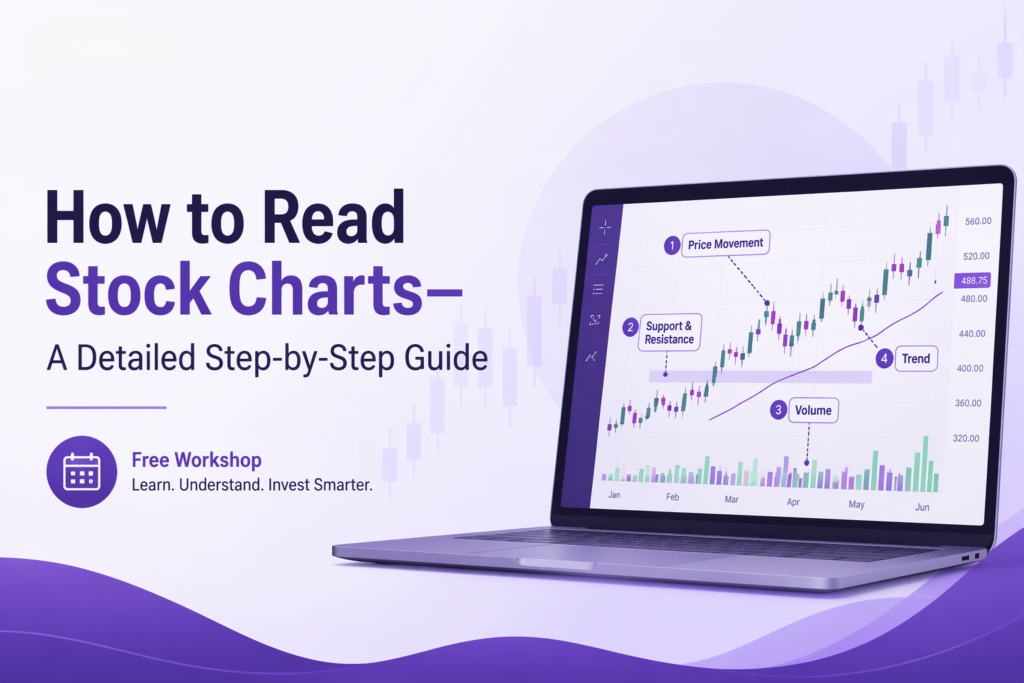
If you cannot read a stock chart, you are trading without seeing what is really happening.
Most beginners rely on news, tips, or what others say. But the market does not pay for opinions. It rewards people who understand how price actually moves. Here is the truth: Every shift in the market already shows up on the chart.
The only difference is that trained traders know how to read it, while others do not. This guide explains how to read stock charts step by step, exactly the way a professional market analyst does it.
What is a Stock Chart?
A stock chart is a picture that shows how a stock’s price changes over time.
It tells you:
- Where the price has been in the past
- Where buyers and sellers are most active
- Which way is the market heading
Charts are more than just lines or candles. They show the real movement of money.
If you want to know the technical analysis, you can check our detailed guide on technical analysis or join our free stock market workshop and become an expert at analysis for free.
7 Steps To Read the Stock Charts
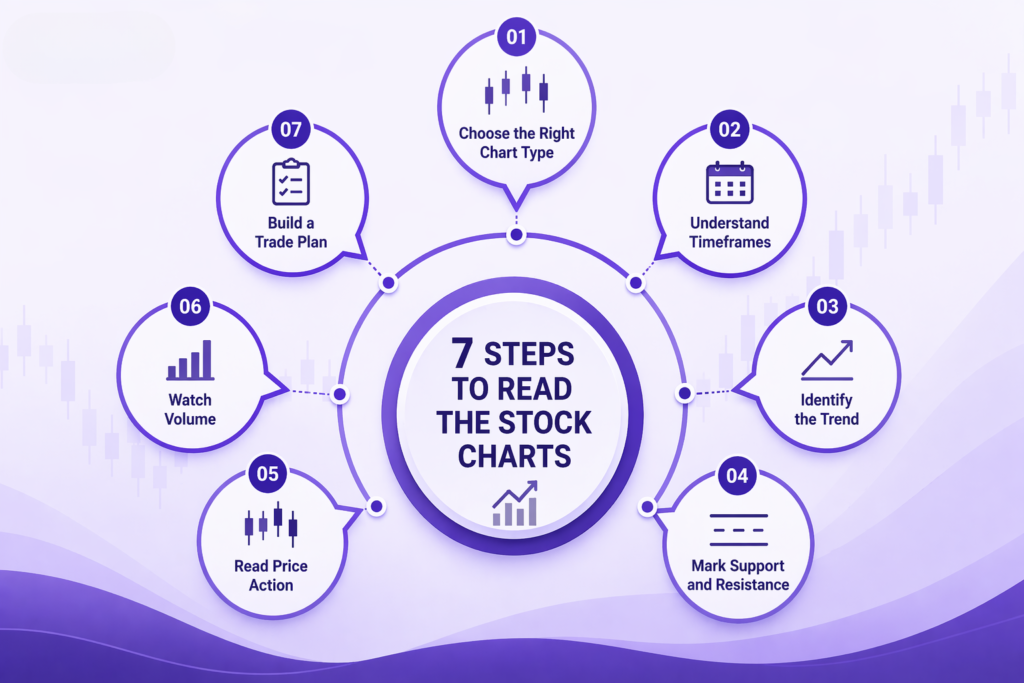
Below, we have covered 7 quick steps to read the stock charts and put them into practice.
Step 1: Choose the Right Chart Type
Charts come in various types, but the most commonly used is the Candlestick chart.
Why Candlestick Charts?
Because they display:
- The opening price
- The closing price
- The highest and lowest prices
- How the market feels at that moment
Each candle shows a story, telling whether the buyers are strong or the sellers are pushing the price down. You’ll start understanding the market once you learn how to read a candlestick chart.
Step 2: Understand Timeframes
Every chart works on a specific timeframe.
- 1-minute → used by intraday traders
- 5-minute or 15-minute → used by short-term traders
- Daily → used by swing traders
- Weekly → used by long-term investors
The same stock can look very different depending on the timeframe you choose.
Smart traders always match their strategy to the right timeframe.
Step 3: Identify the Trend
Before making any move, ask yourself a question: Is the market moving up, down, or staying flat?
There are only three options:
- Uptrend → higher highs and higher lows
- Downtrend → lower highs and lower lows
- Sideways → no clear direction
Golden rule:
Trade with the trend, not against it.
This one step alone stops most beginner errors.
Step 4: Mark Support and Resistance
These are the key levels you must know on any chart.
- Support → the price level where buying usually steps in
- Resistance → the price level where selling usually steps in
Why it matters:
Markets tend to react strongly at these levels again and again. You base your entries, exits, and stop-loss decisions on these zones.
Step 5: Read Price Action
Price action sits at the heart of reading charts.
Instead of depending on indicators first, pay attention to:
- How the candles are formed
- Breakouts
- Rejections at certain levels
- Areas where price stays flat
For example:
- Strong bullish candles show buying power
- Weak candles near resistance often signal a possible turn
Charts have their own language. You just need to learn how to understand it.
Step 6: Watch Volume
Volume tells you whether a price move is solid or shaky.
- High volume with a breakout → reliable move
- Low volume → doubtful or weak move
Many breakouts fail when there is no volume to back them. Always look at price together with volume for clearer signals.
Step 7: Build a Trade Plan
Just reading charts is not enough. You need an actual plan.
A complete trade includes:
- Clear entry point
- Stop-loss level
- Target level
Example:
- Enter the trade near support
- Place a stop-loss just below support
- Set the target near the next resistance
This is what real structured trading looks like.
Common Mistakes While Reading Charts
1. Overcomplicating Charts
Adding too many indicators only creates more confusion. Simple works better.
2. Ignoring Trend
Going against the main trend usually leads to repeated losses.
3. No Risk Management
Even good analysis can go wrong without proper discipline.
4. Jumping Between Timeframes
Switching timeframes without reason leads to mixed signals and poor choices.
Why Most People Struggle with Chart Reading
Let’s be honest.
Most people:
- Watch unrelated videos
- Pick up random pieces of information
- Try to use them without a clear system
That is why they stay confused.
Chart reading is a skill that needs practice, not just collecting facts.
Why Does the Stock Market Workshop Make a Difference?
This is exactly where proper training makes a real change.
A good Stock Market Workshop does not only explain charts. It teaches you how to read them while the market is actually moving.
At Aceink, guided by a SEBI-registered stock market analyst, the training focuses on:
- Hands-on chart reading
- Live market examples
- Step-by-step explanation of trade setups
- Learning why certain trades succeed or fail
This is not about memorizing shapes.
This is about learning to think the way successful traders do.
Free Stock Market Training Online – Learn Chart Reading the Right Way
If you want to learn how to read charts properly, the smartest first step is a free Stock Market training online session that builds everything from the beginning.
Aceink offers a Free Stock Market Workshop where you will learn:
- How to read candlestick charts one step at a time
- How to spot trends and important levels
- How to avoid the usual beginner errors
- How to build clear trade plans
This free stock market workshop is for beginners who value true knowledge over quick tips.
Who Should Attend This Workshop?
This workshop suits you if:
- You are just starting in stock market trading
- You find charts hard to understand
- You are tired of depending on tips and want to decide for yourself
- You want well-organized stock market training online
- You are committed to learning real trading skills
What Changes After Learning Chart Reading?
Once you truly understand charts:
You stop:
- Guessing when to enter trades
- Following random suggestions
- Making decisions based on feelings
You start:
- Reading the overall market structure
- Planning every trade carefully
- Managing risk in a disciplined way
That is when real confidence grows.
Conclusion
In the stock market, learning to read the stock charts is of utmost importance. It brings clarity, order, and better control over your trading choices.
But the method you use to learn it makes all the difference.
Instead of gathering bits of information from everywhere, begin with a clear, structured path led by actual market experience.
Aceink’s Free Stock Market Workshop is built to teach you chart reading from the basics, using practical examples, real market situations, and solid rules.
If you want to move from feeling lost to feeling sure, start with the right foundation.