
Technical Analysis: All You Need to Know for Smarter Investments
Are you ready to unlock the power of technical analysis and enhance your investment game?
In this guide, we’ll delve into the world of technical analysis and understand why it’s a crucial tool for predicting market trends and making informed investment decisions.
Understanding Technical Analysis
Imagine having a crystal ball that could help you predict the future movement of stock prices.
While we don’t have magical orbs, we do have something close: technical analysis.
This method involves examining historical price and volume data to forecast future price movements. Think of it as a detective’s magnifying glass, revealing hidden patterns in the market. To learn more about stock market basics and stock analysis one can consider enrolling in our Stock Market Learning Courses, here.
Also Read: “Top Picks for the Current Market”
The Three Types of Trends
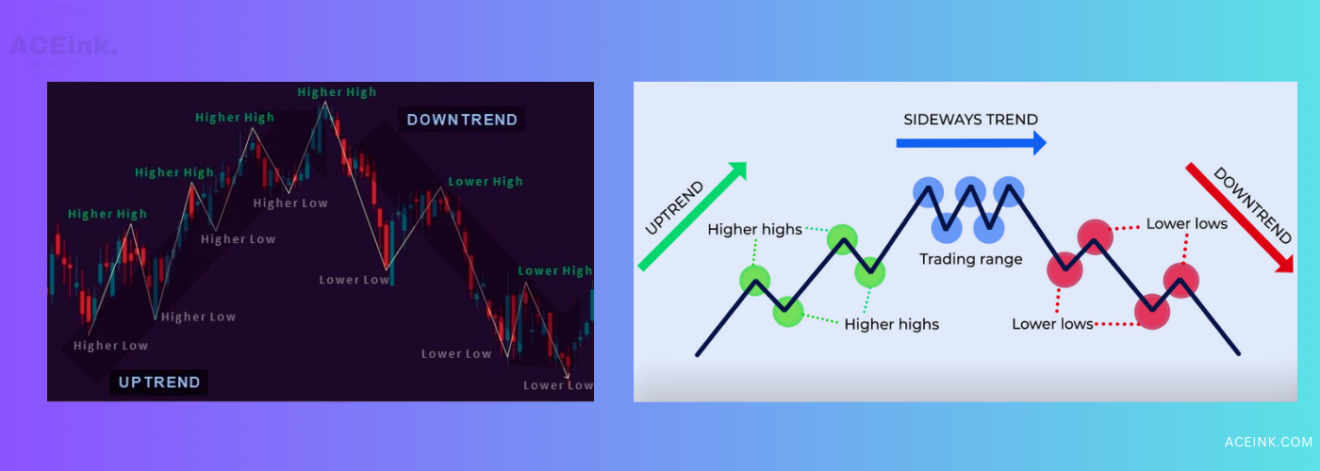
Before we dive deeper, let’s talk trends. Trends are like currents in the ocean of stock prices. There are three main types:
- Uptrend: This is like a roller coaster climbing higher and higher. Prices surge, and each peak is taller than the last. Optimism rules the market, with buyers eagerly snatching up stocks.
- Downtrend: Imagine a roller coaster sliding down, one peak lower than the previous. Pessimism dominates as sellers take the lead, causing prices to drop.
- Sideways (Range-bound) Trend: Here, the roller coaster moves horizontally, with peaks and troughs at a similar level. It’s a stagnant period, where neither the bulls nor the bears have a strong grip.
The Importance of Recognizing Trends
Trends are like signposts, guiding your investment journey. Recognizing them is crucial because they reveal the market’s mood.
Are investors feeling bullish or bearish?
Technical analysis lets you peek into their minds.
Also Read: “Public Sector Banks: Share Prices are Still 80% Down from All-Time Highs Despite Recent Rally
Charts: Your Visual Toolkit
Picture this: you’re a detective investigating a complex case.
What do you need? Clues and a map.
In the world of stocks, charts are your map.
The most common types are line charts, bar charts, and candlestick charts. These visual aids help you track the history of stock prices, making patterns more apparent.
The Magic of Technical Indicators
Numbers tell stories, and in the stock market, they can predict trends. Technical indicators are your secret weapon.
Moving Averages, Relative Strength Index (RSI), MACD, Bollinger Bands, and more.
These indicators give you insights into market momentum, volatility, and potential reversals.
Moving Averages: Unveiling Trends
Imagine you’re at a noisy party, and you want to know the average age of the attendees.
One way to do this is by taking the ages of a few people and calculating their average. Moving Averages work in a similar way, but they’re used in the stock market to uncover trends in prices.
Here’s how it works:
Let’s say you want to know the trend of a stock’s price over the past 10 days. You add up the closing prices of the stock for these 10 days and then divide by 10. This gives you the “moving average” of the stock’s price for that period. As the days pass, you keep recalculating this average by adding the latest day’s closing price and dropping the oldest day’s closing price.
If the moving average is going up, it suggests an uptrend; if it’s going down, it suggests a downtrend.
This helps you see the bigger picture and smoothes out the day-to-day fluctuations.
Relative Strength Index (RSI): Gauging Momentum
Think of the RSI as a fitness tracker for stocks. It measures the speed and change of price movements. Just like your heart rate during a workout, RSI indicates whether a stock is overbought (too popular, possibly due for a decline) or oversold (not popular, possibly due for a rise).
The RSI scale goes from 0 to 100.
If RSI is above 70, the stock might be overbought, and a price correction could be coming. If RSI is below 30, the stock might be oversold, and it could be a good time to consider buying.
MACD (Moving Average Convergence Divergence): Spotting Trends and Changes
MACD is like a detective’s magnifying glass for stock trends and changes. It consists of two moving averages – a short-term one and a longer-term one. The MACD line is the difference between these moving averages, showing you the momentum and direction of a trend.
The MACD signal line, usually a 9-day moving average of the MACD line, helps confirm trends. When the MACD line crosses above the signal line, it might indicate an uptrend (buying signal). When it crosses below, it might suggest a downtrend (selling signal).
Bollinger Bands: Volatility Insights
Picture a rubber band around a stock price. When the stock price moves away from the band, it’s like the rubber band stretching. Bollinger Bands capture this volatility and help you identify potential overbought or oversold conditions.
A Bollinger Band has three components: the middle band, which is a moving average; the upper band, calculated by adding a certain number of standard deviations to the moving average; and the lower band, calculated by subtracting standard deviations from the moving average.
When the stock price touches the upper band, it might be overbought; when it touches the lower band, it might be oversold. However, these bands also adapt to market volatility, expanding when volatility increases and contracting when it decreases.
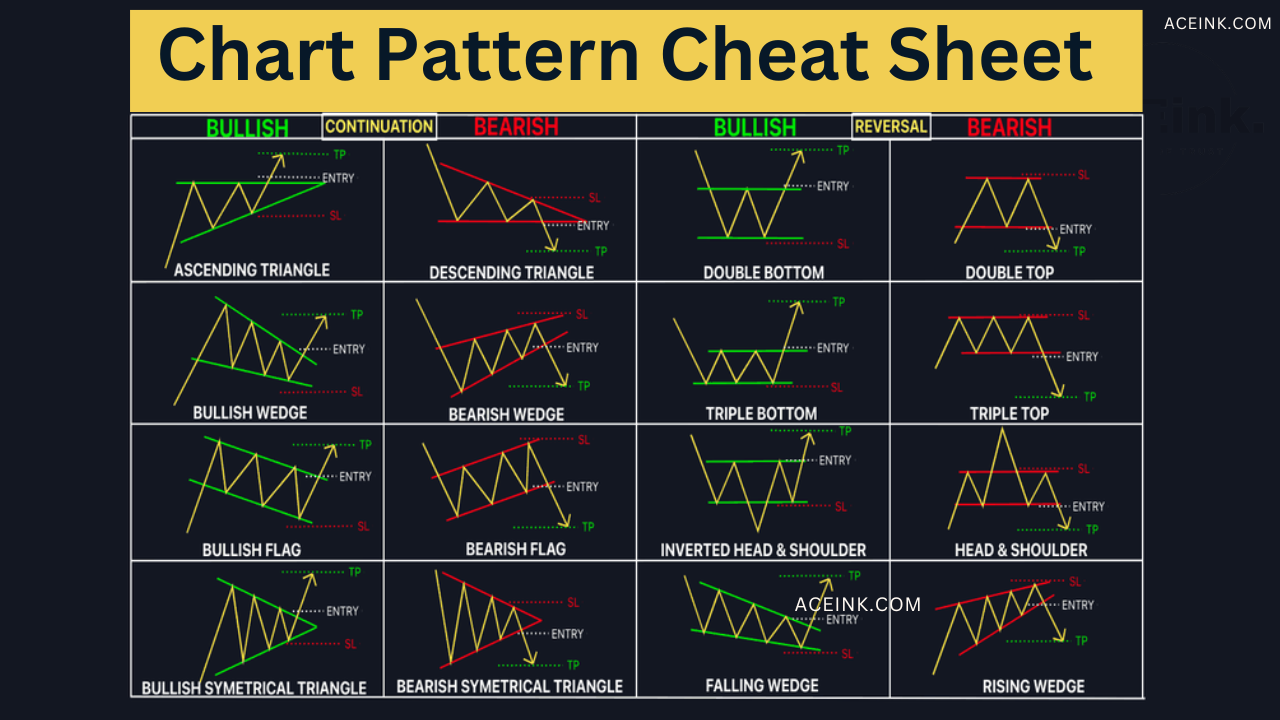
Cracking the Code of Chart Patterns
Just like a detective deciphers codes, you can decode chart patterns.
Head and Shoulders, Double Tops/Bottoms, Cup & Handle
These are like puzzle pieces, forming a picture of potential trend shifts or continuations.
Also Read: “Volatile Markets? These 5 Stocks Offer 40% Upside Potential as Suggested by the Analysts”
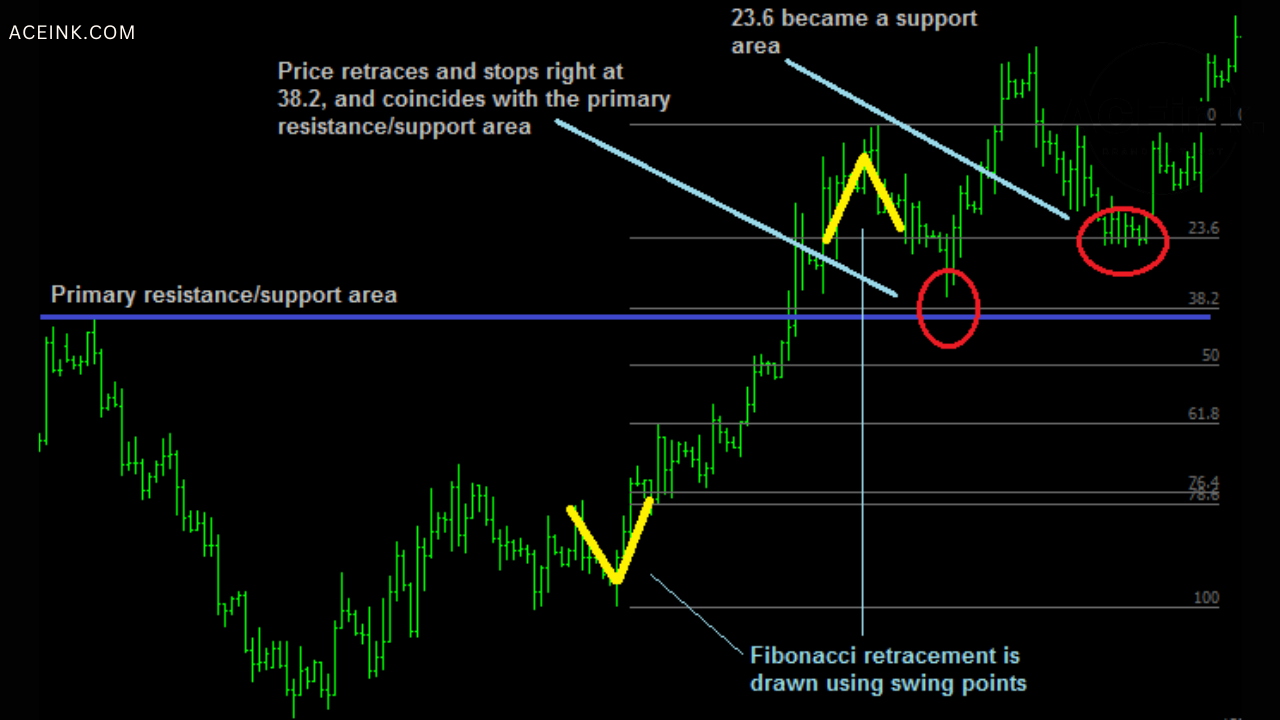
Support, Resistance, and Fibonacci
Ever heard of support and resistance?
These levels act like safety nets and ceilings, influencing stock prices.
Fibonacci retracement, on the other hand, uses mathematical ratios to spot potential support and resistance levels, like secret hideouts for price reversals.
Harmonic Patterns: A Symphony in Trading
In the world of music, harmonies blend beautifully.
In trading, harmonic patterns create melodies of potential reversals.
These patterns, based on Fibonacci ratios, add depth to your understanding of the market’s rhythm.
The Art and Science of Technical Analysis
In a nutshell, the technical analysis combines art and science. By studying historical data, identifying trends, and utilizing tools like indicators and patterns, you become a market detective. But remember, while technical analysis is a valuable guide, it’s not a crystal ball. No analysis can foresee the future with absolute certainty.
So, next time you’re pondering an investment, remember the insights of technical analysis. It’s your guide to deciphering the market’s mysteries and making smarter investment choices. Happy investing!
Please note that we are not SEBI-registered advisors or analysts. All the views shared in this article and all the content shared on aceink.com are only for learning and educational purposes. Any part of the article or any information on Aceink.com should not be interpreted or considered as investment advice. None of the opinions, views, or content posted on Aceink.com constitutes investment advice, as we are not SEBI-registered advisors or analysts.
DISCLAIMER:
We are not SEBI-registered advisors or analysts. All the views shared in this article and all the content shared on aceink.com are only for learning and educational purposes. Any part of the article or any information on Aceink.com should not be interpreted or considered as investment advice. None of the opinions, views, or content posted on Aceink.com constitutes investment advice, as we are not SEBI-registered advisors or analysts.
Aceink.com or any person associated with this website accepts no liability or responsibility for any direct, indirect, implied, or any other consequential damages arising directly or indirectly due to any action taken based on the information provided on this website. Please conduct your own research, and we suggest seeking investment advice only from a SEBI-registered investment advisor.
The views expressed by investment experts, broking houses, news and media houses, rating agencies, etc., are their own and not those of Aceink.com or its management. Aceink.com advises users to consult a SEBI-registered investment advisor before making any decisions.