There are so many beginners who begin using indicators, hoping that they will give precise buy and sell signals. This anticipation tends to cause confusion and inconsistencies. Indicators are not predictive of the market; instead, they support decision-making by demonstrating underlying strength and momentum.
One of the most popular indicators in trading is the RSI (Relative Strength Index). When interpreted properly, it helps traders identify momentum, strength, and potential reversal areas. Nonetheless, it may lead to poor decisions when applied out of context.
This guide describes RSI in a well-organized, practical manner, enabling clear implementation in market conditions.
What is RSI (Relative Strength Index)?
RSI is a moving average indicator that quantifies the pace and magnitude of the recent price changes. It swings between 0 and 100 and assists traders to know whether a stock is overbought, oversold or neutral.
The default RSI configuration is 14 periods and this works well in most timeframes. RSI would be better applied to know how strong or weak a move is as opposed to just looking at the levels.
Understanding RSI Levels
RSI only makes sense when you know how the various zones of RSI react to various market conditions.
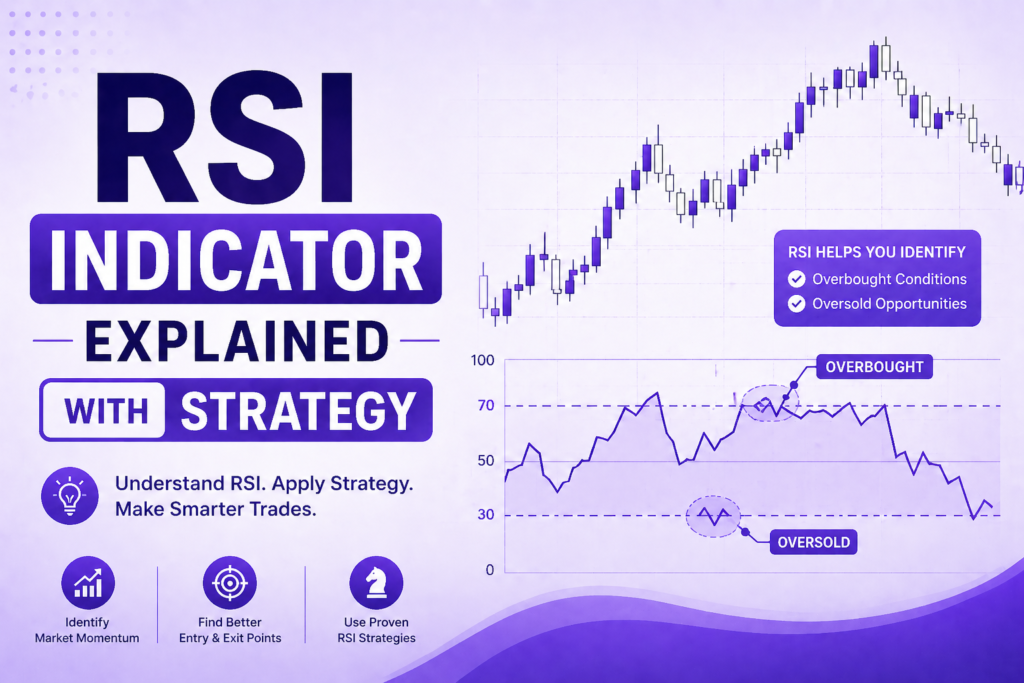
Overbought Zone (Above 70)
An RSI above 70 indicates strong buying momentum. This, however, does not necessarily imply that the price will turn around. During powerful uptrends, RSI may remain above 70.
Oversold Zone (Below 30)
A RSI below 30 indicates good selling pressure. This does not necessarily mean that it will reverse immediately, as is the case with overbought conditions. When the market is in a strong downward trend, RSI might remain oversold longer than it should have.
Neutral Zone (30–70)
This is the area where most price movement occurs. RSI in this zone indicates normal market behavior and no extreme conditions.
The Biggest Mistake Beginners Make with RSI
One of the most frequent errors is to work with RSI as a direct signal: sell when RSI above 70, buy when below 30. This method pays little attention to the market context and is likely to result in losses.
RSI is not meant to be used alone. To identify a Trend properly, always combine it with price structure and overall market direction for more accurate signals.
How RSI Works in Real Trading
RSI is efficient when applied alongside trend analysis. Traders ought to look at how RSI reacts to the broader market environment rather than the levels.
RSI Strategy Based on Trend
RSI in an Uptrend
In an uptrend, the RSI typically remains above 40 and stays between 40 and 80. RSI is more likely to support itself in the 40–50 range than to enter the oversold zone.
Under these circumstances, buying opportunities may arise on pullbacks to these levels, particularly when accompanied by price action.
RSI in a Downtrend
RSI tends to be in the lower 20s to 60s during a downtrend. It is hard to gain above 70, and it is frequently resistant in the 50-60 range.
Rallies towards these levels can offer selling opportunities, in this case, when the price is weak.
RSI Divergence Strategy
Divergence is among the most valuable RSI concepts, as it indicates a possible change in momentum.
Bullish Divergence
This happens when price makes a lower low, whereas RSI makes a higher low. It indicates that the selling pressure is decreasing and a possible upward movement can happen.
Bearish Divergence
This happens when the price is high, but the RSI produces a lower high. It shows that the momentum of buying is declining and it can go downwards.
It is noteworthy that divergence is one of the early indicators, and it should always be verified by price action.
Combining RSI with Support and Resistance
RSI is much more effective when used with significant price levels.
To illustrate, when the price nears a solid support zone, and the RSI is in the oversold area, chances are that the price will rebound. Equally, when the price approaches resistance and the RSI is overbought, this reinforces the argument that a rejection could occur.
This combination enhances decision-making by providing context for RSI signals.
Step-by-Step Approach to Using RSI
An organized strategy will prevent confusion and enhance consistency:
- Determine the general market trend through price structure
- See what RSI is doing in that trend
- Note key support and resistance levels
- Find congruence between price action and RSI signals
- Only after confirmation enter trades
This approach will mean RSI will assist you in making decisions, not dictate them.
Common Mistakes While Using RSI
RSI may be abused even by the most experienced traders unless they pay attention to context. Common mistakes include:
- Applying RSI on its own
- Ignoring trend direction
- Taking up trades based on overbought or oversold only
- Overtrading as a result of high-frequency signals
- Failing to wait to be confirmed
These errors can be avoided and this greatly enhances accuracy and consistency.
Why RSI is Important in Stock Market Learning
RSI helps traders understand momentum, one of the essential elements of market behavior. It makes the complicated price movements simpler and gives an understanding of strength and weakness.
This makes RSI a vital aspect of organized Stock Market Learning, particularly for beginners establishing their footing.
Learn RSI Strategy with Practical Understanding
The conceptual understanding of RSI is straightforward, yet using it effectively in practical markets requires guidance and experience.
Founded by SEBI Registered Stock Market Analyst Bharath Shankar, Aceink is a company that specializes in practical learning with their Free Stock Market Webinar. During this session, traders will understand RSI’s behavior under real-world conditions, the pitfalls to avoid, and how to effectively combine it with price action.
This strategy helps close the theory and practice gap.
Conclusion
RSI is an effective tool that can be used with good sense and discipline. It is an excellent indicator of the market momentum, but must be combined with trend and structure.
RSI, when used properly, can be a useful tool to enhance trade timing and decision-making.
Aceink assists traders in building such understanding through its Free Stock Market Webinar, where ideas are taught using real-market examples and structured learning.