The majority of beginners seek advanced tactics, believing that more indicators equal higher accuracy. However, in practice, simple, well-understood tools can make some of the best trading decisions.
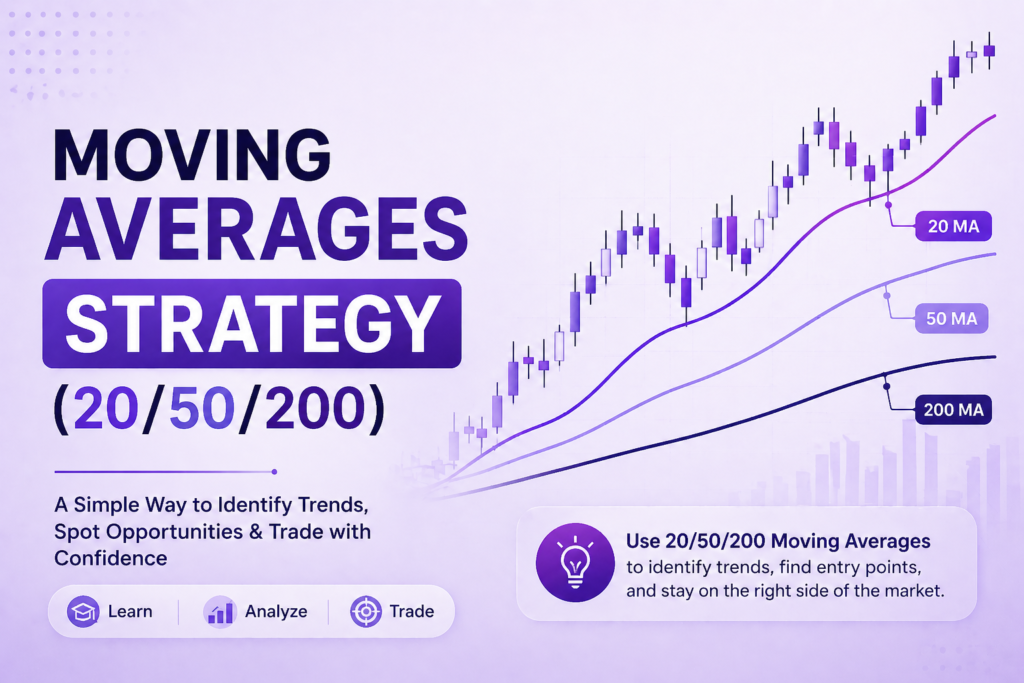
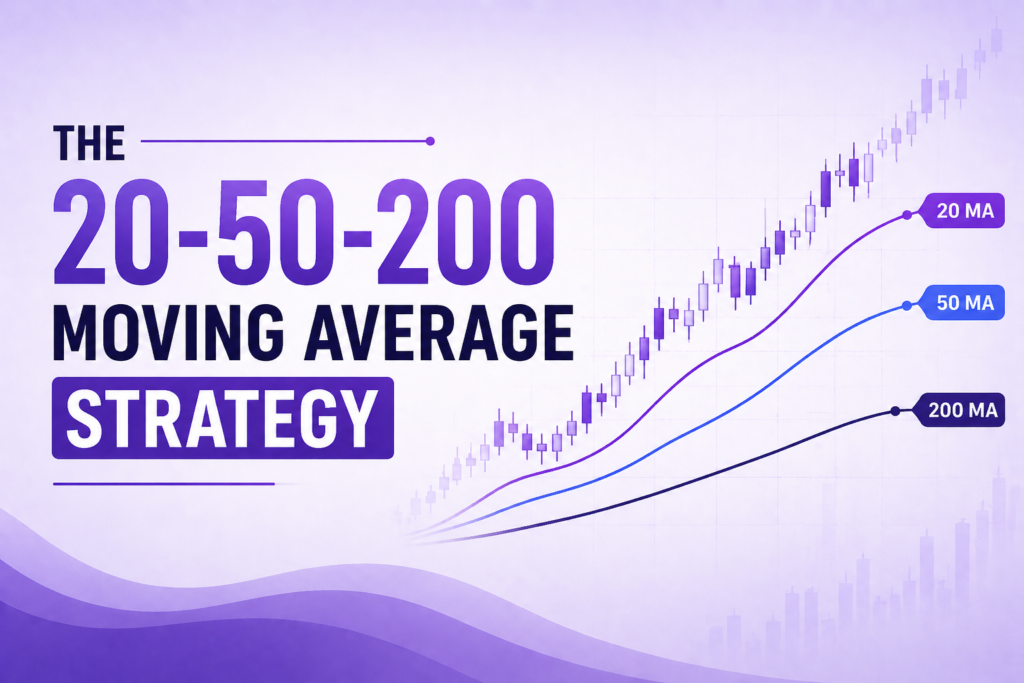
The most effective of them is the Moving Average strategy, namely the 20-, 50-, and 200-day moving averages. These are not lines on a chart.
They are trends, momentum and market behavior. When properly applied, they help you filter noise and make structured decisions.
What are Moving Averages?
A moving average is a graph showing the average price of a stock over a given period.
For example:
- 20 MA = Average price of the 20 most recent periods.
- 50 MA → Mean price in 50 consecutive periods.
- 200 MA = Mean value of past 200 periods.
The average is moving, as the price is changing, hence the name, a moving average.
It smooths price action and helps identify the underlying trend.
Why 20, 50, and 200 Moving Averages Matter
The reason these three are popularly utilized is due to the fact that they depict an alternative view of the market.
- 20 MA → Short-term trend
- 50 MA → Medium-term trend
- 200 MA → Long-term trend
All of them provide a complete picture of the market structure.
This mix assists merchants to work in tandem with the greater picture rather than responding to minor changes.
Understanding Each Moving Average
20 Moving Average (Fast Line)
The 20 MA responds rapidly to any change of price.
It is useful for:
- Identifying short-term momentum
- Identifying early trend changes
- Trading in live markets
Staying above price 20 MA implies a short-term strength.
50 Moving Average (Balance Line)
The 50 MA offers a more stable and less rugged look.
It is commonly used to:
- Confirm trend direction
- Identify pullback opportunities
- Filter false signals
It is a dynamic support or resistance to trending markets.
200 Moving Average (Major Trend Line).
The long-term trend is the 200 MA.
Institutions are numerous followers of it.
Above 200 MA – Long-term bullish.
Price lower than 200 MA: Long-bearish.
Overall market bias is defined by this line.
The 20-50-200 Moving Average Strategy
The method is effective as it involves a combination of all three moving averages to gain an insight into trend alignment.
Rather than you are monitoring a single signal, you are monitoring how these lines are interacting with each other and price.
Bullish Setup
An excellent bullish pattern takes the form of the following:
- Price above 20, 50, and 200 MA
- 20 MA above 50 MA
- 50 MA above 200 MA
This alignment shows:
- Strong upward trend
- Healthy momentum
- Buyer dominance
Under these circumstances, traders seek a purchase on pullbacks.
Bearish Setup
A bearish formation appears as following:
- Lower price than all three moving averages
- 20 MA below 50 MA
- 50 MA below 200 MA
This indicates:
- Downtrend
- Weak momentum
- Seller dominance
Traders specialise in selling chances or shunnings.
Golden Cross and Death Cross
These are popular market indicators.
Golden Cross
On passing 50 MA over 200 MA.
Indicates possible long term positive trends.
Death Cross
When 50 MA goes below 200 MA
Portends positional to weakness.
How to Use Moving Averages in Real Trading
Moving averages are not independent signals. They are used effectively in combination with structure.
Entry Strategy
- Await convergence to moving averages
- Fly in on pullbacks to 20 or 50 MA
- Seek confirmation in terms of price action
Exit Strategy
Get out when the price falls below a significant moving average.
Or in cases of diminished trend structure.
Stop-Loss Placement
- Less than 50 MA in uptrend
- Down and over 50 MA
This aids in risk management.
Common Mistakes Beginners Make
Even tools that are simple can break when they are not used properly.
- Trading with moving averages in lateral markets
- Blind use of crossover signals
- Ignoring overall trend
- Late entrants with large moves
- Failing to combine with price action
These errors lessen efficiency.
When Moving Averages Don’t Work
Moving averages have problems in:
- Sideways markets
- Low volatility conditions
- Choppy price action
Signals are not reliable in such situations.
This is the reason why context is important.
Why Moving Averages are Important in Stock Market Learning
Moving averages assist novices:
- Understand trend direction
- Reduce noise
- Build structured thinking
They serve as a guide in Stock Market Learning since they make sophisticated price action easier.
Learn Moving Averages the Right Way
It is easy to understand moving averages in theory.
Most traders have difficulties when applying them in live markets.
Aceink, headed by SEBI-registered stock market analyst Bharath Shankar, is committed to imparting practical knowledge through the Free Stock Market Webinar.
During this session, you will learn:
- The correct use of 20, 50 and 200 moving averages
- False signals to avoid
- Combining price action and moving averages
- Learning to develop a disciplined trading approach
This will assist you in moving out of confusion to clarity.
Conclusion
The moving averages of 20, 50, and 200 are easy-to-use, powerful tools. They help you in comprehending trends, momentum, and construction without overbearing charts.
When utilized in an orderly and correct context, they are a powerful segment of your trading system.
Aceink will assist you in perfecting these, and in the process you will understand how to use moving averages in real market situations at its Stock Market Free Workshop.