
The Danger of Buying Penny Stocks (And What to Buy Instead)
Lots of people just starting in investing get drawn to penny stocks. They look cheap and seem like they could deliver huge profits. A share going for ₹5, ₹10, or ₹20 feels easier to buy than one at ₹1,000 or ₹2,000. New investors often think that grabbing a big bunch of these low-priced shares gives them a real shot at making serious money. Social media groups, online discussion boards, and market chatter keep spreading stories about penny stocks that shot up fast and made people rich quick. But what most new investors miss is the real risk in chasing penny stocks. Sure, there are a few that may bring massive wins, but most have substantial risks that can destroy your savings and cause your confidence to be shaken quick. When you’re prepared to buy into these cheap stocks, consider the dangers you may encounter and the other investments that can help you build wealth in the long run. What Are Penny Stocks? Penny stocks are usually shares from small companies that trade at very low prices and often have a small overall market value. These stocks pull in investors because: However, a low share price does not automatically mean a stock is undervalued or a good investment opportunity. Understanding the Danger of Buying Penny Stocks The biggest mistake beginners make is thinking low-priced stocks are safer just because each share costs less. In reality, the real trouble with penny stocks comes from issues that stay hidden behind that tempting low price. Poor Business Fundamentals Many penny stocks come from companies that show weak financial results, little room to grow, or shaky business plans. Some companies may struggle with: Without strong fundamentals, long-term growth becomes difficult. High Volatility and Unpredictable Price Movements Penny stocks can swing wildly in price over very short periods. This type of movement can seem exciting, but it can cause severe issues for the inexperienced. Large price fluctuations can lead to: This is one of the major reasons behind the danger of buying penny stocks. Low Liquidity Risks Liquidity means how easily you can buy or sell shares without big trouble. Many penny stocks have very low trading activity, so it gets tough to sell when you want out. Increased Manipulation Risk Penny stocks face more chances of hype and manipulation than others. Rumors, heavy promotion, and sudden buzz can push prices up for a while without real reason. Once the excitement dies down, prices usually drop hard, trapping investors who got in late. This is a common example of the danger of buying penny stocks that many beginners face. Limited Information Availability Large businesses show a lot of financial information, receive a lot of stock analyst reports, and are likely in the news a lot throughout the year. A lot of penny stocks receive little or no coverage and updates. As a result, investors often decide without enough facts, which raises the chance of losing money. Why Beginners Are Attracted to Penny Stocks Even with all these risks, penny stocks stay popular with new investors. The Illusion of Affordability Many investors think that it is better to own 1000 shares of a stock with a face value of ₹10 than 10 shares of a stock with a face value of ₹1000. In fact, it’s not the amount of shares, it’s the actual value of the company and the chances of them rising. Fear of Missing Out When the stock price is up 1000%, or even 500%, rumors abound, and false hopes are built. This forces them to act on hot tips instead of doing the right homework. Desire for Quick Profits Many beginners jump in wanting to get rich fast. Unfortunately, this thinking often leads to bad choices and taking risks they don’t need. What Should You Buy Instead? Steering clear of the danger of buying penny stocks doesn’t mean you have to skip growth chances. Rather, concentrate on solid companies with more fundamental components and growth potential in the long-term. Fundamentally Strong Companies Businesses that are financially sound, growing and have well-planned business strategies are likely to provide more reliable results. Important factors to evaluate include: Market Leaders Leaders in their industries normally run established operations, keep stronger finances, and have a history of delivering results. They might not give instant big jumps, but they bring more stability and real potential to build wealth over the years. Stocks with Strong Technical Structure For traders, looking at charts helps spot stocks that show: These features often create better setups than picking random penny stocks. Companies Showing Consistent Growth A business that is always striving to be better in selling, making money and running its business day in and day out is sure to get serious investors in the long run. Paying attention to real growth quality instead of just low prices can make a huge difference in your results. How Technical Analysis Helps Avoid Poor Stock Selection Many investors only look at the share price and ignore how the stock actually moves on charts. Technical analysis helps identify: This gives you a clearer way to pick stocks. Learn How Experienced Traders Evaluate Opportunities Professional traders and investors hardly ever buy something just because it’s cheap. Instead, they check: This clear method helps them make smarter choices and avoid extra risks. Learn Stock Selection Through Aceink’s Free Stock Market Webinar If you want to stay away from the danger of buying penny stocks and see how seasoned market players pick opportunities, Aceink’s Free Stock Market Webinar can really help. Led by SEBI Registered Research Analyst Bharath Shankar, the webinar covers: The workshop is designed to help beginners understand the stock market through practical and structured education. Conclusion The danger of buying penny stocks often gets overlooked by beginners who only see the low prices and possible big rewards. While a few penny stocks may deliver amazing returns, most bring serious problems tied to weak fundamentals, low liquidity, wild price swings, and market hype. Good investing isn’t
Step-by-Step Guide to Journaling Your Trades
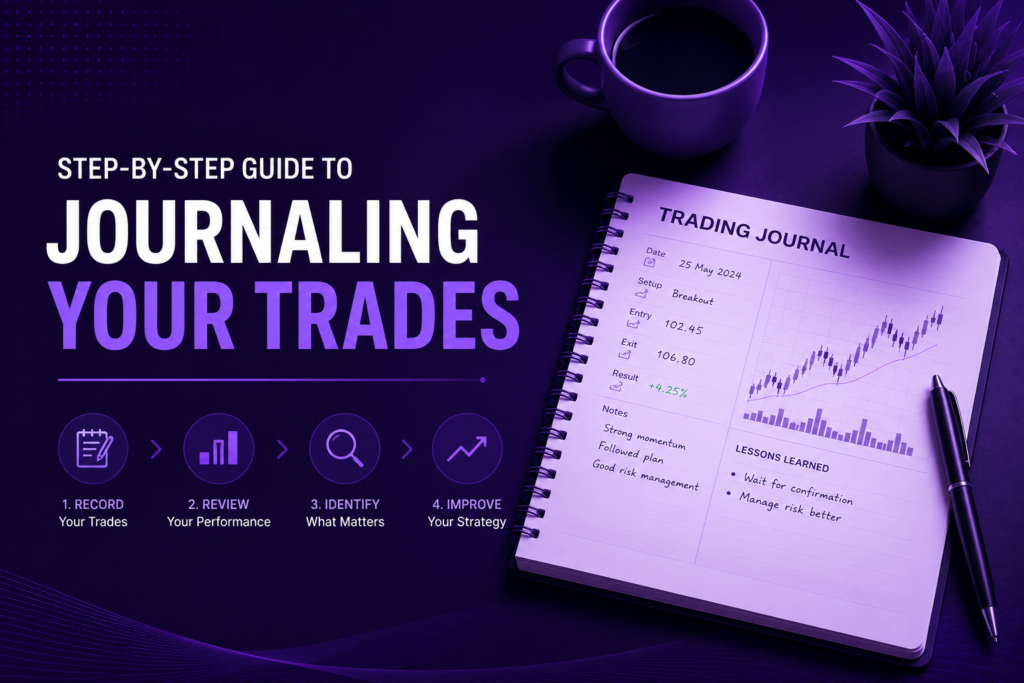
The majority of traders spend millions of hours searching for superior indicators, new strategies, and tips to succeed in the stock market. Nevertheless, a Trading Journal is often overlooked as one of the most effective tools for enhancing trading performance. Experienced traders know that long-term success is achieved through continuous improvement. They do not look only at profits and losses. They debate their choices, identify their mistakes, and seek methods to improve their implementation. A Trading Journal that is kept up to date helps traders understand what is working and what is not, as well as where they should improve. It makes trading more of an analysis- and discipline-based process rather than a guessing game. When trading consistently, if emotional errors or just becoming a more disciplined trader is your aim, then knowing how to keep a proper trading journal is necessary. What is a Trading Journal? A Trading Journal is a detailed record of every trade you take in the market. Instead of simply recording profits and losses, a journal helps track: Over time, this information becomes one of the most valuable resources for improving trading performance. Why Every Trader Needs a Trading Journal The importance of journaling is underestimated by many traders, who think they will remember their errors. The truth is not so. Most of the traders make the same mistakes repeatedly without any documentation. Improves Trading Discipline A trading journal creates accountability. When traders know they must review every decision later, they are more likely to follow their trading plan and avoid impulsive decisions. Strong trading discipline often begins with consistent journaling. Helps Identify Repeated Trading Mistakes Many traders lose money because they continue making the same mistakes. A journal helps reveal patterns such as: Recognizing these patterns is the first step toward improvement. Improves Trading Psychology Accountability is created by a trading journal. Traders are more likely to adhere to their trading plan and not make impulsive decisions when they are aware that they will be reviewing all their decisions in the future. Good trading discipline frequently starts with regular journaling. Tracks Trading Performance Without proper records, it is difficult to know whether a strategy is truly working. Journaling allows traders to measure: This creates a more objective view of trading performance. Builds Trading Consistency Coherence is achieved through the repetition of good habits and the discarding of negative habits. The trading journal helps traders focus on process improvement rather than quick results. This enhances consistency in trading gradually. What Should You Record in a Trading Journal? A general-purpose trading journal must be able to record technical information and psychological information. Entry Price Note down the particular price at which the trade has been made. This helps assess the level of entries. Exit Price Record in which the trade was closed and compare it with the plan. Stop Loss Always note down the level of stop-loss at which the trade takes place. This is useful in risk management assessment in trading. Risk-Reward Ratio Document the expected reward compared to the amount being risked. In the long run, this helps determine whether the trades are good opportunities. Trade Setup Record the reason for entering the trade. Examples include: This makes trade analysis easier later. Emotional State Many traders skip this section, but it is extremely valuable. Ask yourself: This helps identify emotional trading patterns. Lessons Learned Every trade teaches something. Record key observations and lessons after each trade, regardless of whether it was profitable or not. Step-by-Step Guide to Maintaining a Trading Journal Following a structured process makes journaling much easier. Step 1: Create a Journal Format Use a spreadsheet, notebook, or journaling software. The format matters less than consistency. Step 2: Record Every Trade Immediately Do not rely on memory. Document trade details as soon as possible after execution. Step 3: Capture Screenshots Save chart screenshots showing: Visual records improve learning significantly. Step 4: Record Your Reasoning Explain why you entered the trade. This helps determine whether decisions followed your trading plan. Step 5: Analyze the Outcome After the trade ends, review: Step 6: Review Weekly Set aside time each week to review your journal. Look for recurring patterns in: Step 7: Adjust and Improve Use the insights from your journal to refine your trading process and eliminate repeated mistakes. Common Trading Journal Mistakes to Avoid Many traders start journaling but fail to use it effectively. Avoid these mistakes: How Reviewing Your Journal Improves Trading Results A journal becomes powerful when reviewed regularly. Consistent review helps traders: Over time, small improvements create significant performance gains. Why Most Beginners Skip Journaling Most novices feel that they do not need to engage in journaling as it does not directly translate into profits. But good merchants know that they can only get better by studying themselves. One of the most useful tools for long-term development is a Trading Journal, which assists traders in learning from the winning and losing trades. Learn Professional Trading Habits Through Aceink’s Free Stock Market Webinar Many successful traders follow structured routines that include journaling, risk management, trade reviews, and disciplined market analysis. Aceink’s Free Stock Market Webinar helps participants understand these professional habits through practical market education. Led by SEBI Registered Research Analyst Bharath Shankar, the webinar covers: Participants also learn how professional traders review their performance and improve decision-making over time. Conclusion Not just a Trading Journal is a record of gains and losses. It is an effective instrument that assists traders in enhancing discipline and trading psychology, recognizing common errors, and establishing long-term trading consistency. The majority of traders focus on developing improved strategies without considering the importance of self-analysis. The thing is, knowing yourself and your actions often yields greater improvements than switching approaches every now and then. With a well-organized trading journal and regular review, traders can make better decisions, take wiser risks, and improve their overall trading performance. In a bid to understand more about trading discipline, risk management, technical analysis, and professional trading habits, attend the
Why Traditional Indicators Fail And What to Look at Instead
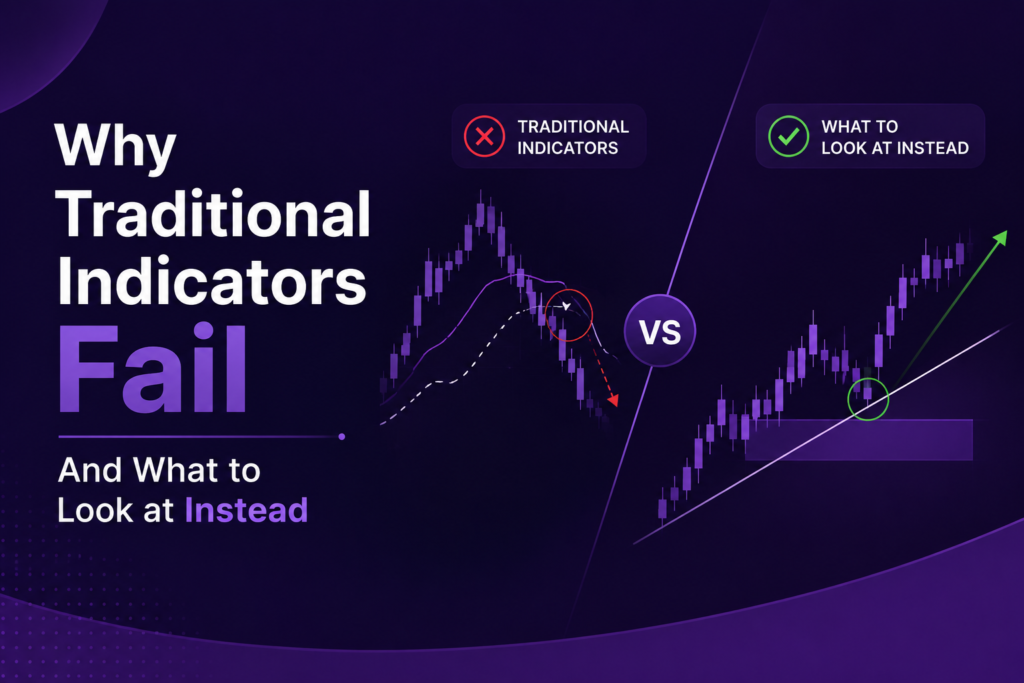
Traditional indicators are the starting point of most traders in the stock market. They include RSI, MACD, Moving Averages, Bollinger Bands, Stochastic Oscillators, and a few other tools on their charts in their quest to identify the ultimate buy and sell signals. At first glance, Traditional indicators appear useful because they make market analysis easier. Nevertheless, a couple of months later, most traders come to appreciate that indicators are not enough to achieve profitable trades. Signals can become faulty, false breakouts can occur, and losing trades can be experienced even when using indicator-based strategies. This is what makes traders think that technical analysis fails. This is not the case. It is not the issue of technical analysis. The issue is with the majority of traders applying indicators. Learning to avoid the pitfalls of Trading Indicators can help traders focus on what really matters and make the right decisions in the market much more effectively. Why Most Traders Depend Too Much on Indicators Indicators are appealing to the eye because of their apparent simplicity and objectivity. Traders are seeking something simple with indicators rather than analyzing market structure, trend strength, or price action. Many beginners ask: This, unfortunately, results in traders becoming dependent and failing to learn to read real charts. Why Traditional Trading Indicators Fail The Traditional indicators are powerful but have their limitations. These are some limitations every trader should know. Indicators React After the Move Has Started The majority of conventional indicators are based on previous price history. This is because they respond to what has already occurred rather than anticipating what is to come. An illustration of this is that a Moving Average crossover may frequently indicate that much of the movement has already occurred. By the time the signal comes up, a fair share of the opportunity might be lost. That is one of the main reasons Trading Indicators Fail when blindly followed by traders. Too Many False Signals All traders have found themselves in situations where indicators provide signals that fail very quickly. Markets are always moving between trending and sideways markets. A strong trend indicator can produce a series of false signals when in a consolidation period. This is confusing and extraneous waste. Indicators Ignore Market Context A buy signal does not necessarily imply a good trade. To trade successfully, one needs to know the following: The traditional indicators tend to lack this general market picture. One Indicator Cannot Work in Every Market Numerous merchants spend years finding an ideal pointer. The truth is that no indicators are effective under all market conditions. Other markets, such as trending, volatile, and sideways markets, do not behave the same way. It is not realistic to expect a single tool to work equally well in all environments. Most Beginners Use Indicators Incorrectly Most problems associated with traditional indicators come from improper use, not from shortcomings in the indicators themselves. Common mistakes include: Such errors lower the trading performance. What Smart Traders Focus on Instead Professional traders do not often rely on indicators. Rather, they concentrate on market behavior. Market Structure Market structure is a useful source of information regarding trend direction and momentum. Knowing higher highs, higher lows, lower highs, and lower lows allows traders to detect market strength better than an indicator can. Trend Analysis Strong trend analysis enables traders to trade in line with market direction and not against it. Knowledge of whether the market is: helps the selection of trade to a large extent. Price Action The price action shows what the buyers and sellers are really doing. Rather than relying on indicator signals, seasoned traders are able to see: This gives more insight into the market. Volume Confirmation Volume helps traders understand the movement behind it. Strong volume, backed by a breakout, can be more important than a breakout on weak participation. This extra assurance enhances the quality of the decision. Risk Management The analysis itself can even fail, even the best one. This is why professional traders are more concerned with risk management than with prediction. Effective risk management helps safeguard capital and enhance trading stability over the long term. How Aceink Trading Indicator Simplifies Market Analysis After identifying shortcomings in conventional indicators, Aceink developed the Aceink Trading Indicator to make traders’ analysis much easier. Rather than adding unnecessary complexity for traders, the indicator aims to enhance market visibility and support structured decision-making. Built for Better Market Clarity Determining the market’s direction with certainty has been one of the greatest challenges traders face. The Aceink Trading Indicator can assist in streamlining trend interpretation and understanding the market. Helps Identify Market Direction Faster To be a successful trader, it is important to understand whether the market is bullish, bearish, or in the process of consolidation. The indicator will assist traders in identifying the dynamic market conditions more effectively. Simplifies Trend Analysis One of the crucial elements of technical analysis is trend analysis. The Aceink Trading Indicator assists traders who need to focus on trend-driven opportunities and avoid letting short-term noise distract them. Helps Traders Focus on High-Probability Setups The indicator does not create a need to engage in excessive trading; rather, it helps traders identify clearer opportunities and avoid unnecessary market participation. Designed for Practical Market Conditions Markets are dynamic and ever-changing. The Aceink Trading Indicator is grounded in practical market use, enabling traders to enhance their trading experience and overall market understanding. Learn How the Aceink Trading Indicator Works The Aceink Trading Indicator is best understood through practical examples and real-world market scenarios. Aceink offers a Free Stock Market Webinar every Sunday during which traders get to learn the following: The webinar is based on SEBI-registered Research Analyst Bharath Shankar and is aimed at both novice and mature market participants. Conclusion Traditional indicators are not magic solutions and can still be helpful tools. In the majority of cases where Traditional Indicators Fail, traders rely solely on them and pay no attention to market structure, market trends, price action, or risk management.
Join Free Online Trading Workshop Every Sunday
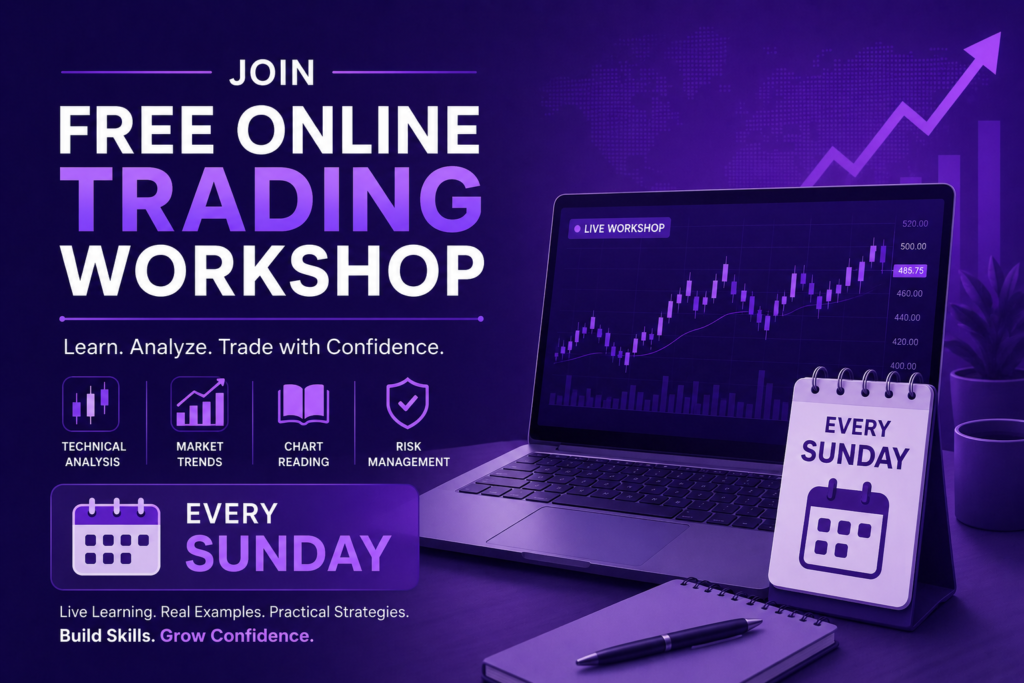
An Online Trading Workshop provides beginners with a structured path to understand how the stock market works and how successful traders make informed decisions. Many new traders spend months watching videos, reading articles, and following market influencers, yet still struggle to analyze stocks, manage risk, or identify quality trading opportunities. The issue is not a lack of information but a lack of organized learning. A well-designed Online Trading Workshop helps participants learn essential concepts in the right sequence, making the learning process practical and easier to apply. Aceink’s Free Sunday Workshop is designed specifically for beginners looking to build a strong foundation in stock market trading and investing. Led by SEBI-registered Research Analyst Bharath Shankar, the workshop combines real market insights, practical education, and proven trading principles to help participants develop confidence and avoid common beginner mistakes. Why Beginners Should Join an Online Trading Workshop The stock market is not only about the buying and selling of stocks. To be a successful participant in the market, it is important to understand market trends, risk management, technical analysis, and investor psychology. Learn Stock Market Trading and Investing in a Practical Way The stock market is not just about buying and selling stocks. Successful market participation requires an understanding of market trends, risk management, technical analysis, and investor psychology. Aceink’s workshop focuses on helping participants understand: This practical approach helps participants build confidence gradually. What You Will Learn in Aceink’s Online Trading Workshop The workshop is designed to provide a complete introduction to stock market trading and investing. Swing Trading Strategies Explained Swing trading is one of the most popular approaches among traders because it allows participants to capture short-term market movements without constantly monitoring charts. Participants learn: This helps beginners understand how structured swing trading works. Intraday Trading Setups Used by Active Traders Many beginners are curious about intraday trading but often struggle to understand the process. The workshop explains: Short-Term Investing Opportunities Not all market players desire to trade actively. The workshop also outlines the ways in which the short-term form of investment can be used to find opportunities but has a disciplined process of investment. Long-Term Multibagger Investing Concepts Long-term investing remains one of the most effective approaches for wealth creation. Participants learn: Learn to Trade and Invest Like Institutions This forms a harmonious perception of investing and trading. Proven Trade Setups Learning about the decision-making by the experienced market participants is one of the most useful parts of the workshop. Easy-to-Use UP-Trend and Down-Trend Indicators One of the most important technical analysis skills is trend identification. The workshop explains how traders can use simple trend indicators to gain clearer insight into market direction and avoid unnecessary confusion. How to Use AI for Trading and Investing Artificial Intelligence is transforming how market research is performed. Participants learn how AI can support: This introduces modern tools that can improve efficiency and decision-making. Risk Management and Market Psychology Many traders fail because they focus only on opportunities while ignoring risk. The workshop covers: These concepts help build stronger market habits. How to Find High-Potential Stocks Early One of the investing skills that is important is the ability to see quality opportunities before they become popular. The participants are taught practical frameworks to enhance stock selection and market analysis. Why Attend the Workshop Every Sunday? One of the most significant aspects of learning about the stock market is consistency. Aceink holds its online trading workshop once in a week on Sunday to enable its participants to receive frequent chances to acquire more knowledge and comprehension of the market. It is best on Sunday, since participants will be able to study without distractions from the activities in the live markets. This will help develop an improved learning and skills environment. Learn from SEBI-registered Research Analyst Bharath Shankar The workshop is conducted under the guidance of Bharath Shankar, a SEBI-registered research analyst. Participants benefit from structured market education focused on: The focus remains on education and practical understanding rather than unrealistic market expectations. Who Should Join This Online Trading Workshop? This workshop is ideal for: Why Aceink’s Online Trading Workshop Is Different Most of the educational programs are theory-oriented. Aceink focuses on practical market teaching that participants can understand and implement. The workshop offers: Conclusion The stock market is a place that rewards knowledge, discipline, and learning. The problem is that many beginners fail to make progress because they learn from fragmented information rather than according to a plan. Attending an online trading workshop offers a hands-on experience to gain confidence in the market, learn technical analysis, enhance their investing knowledge, and trade consistently and with discipline. The Free Sunday Workshop by Aceink, under the guidance of SEBI-registered research analyst Bharath Shankar, helps participants master the art of trading and investing in the stock market by offering practical education on swing trading and intraday setups, long-term investing, AI-powered market research, risk management, market psychology, and stock selection. Whether you are new to the stock market or simply wish to enhance what you already know, this free workshop will provide you with an outstanding chance to be educated by the professionals of the market and be the next step to becoming a smarter trader and investor.
How Free Trading Workshops Build Market Confidence
The stock market offers enormous opportunities for wealth creation, though for most beginners, the greatest challenge is not finding them. Confidence is the greatest challenge. Many people want to start trading or investing but don’t because they fear making mistakes, losing money, or making the wrong choices. They spend a lot of time on videos, reading articles, and working with market influencers, and yet they remain confused about how to analyze a stock or trade. This lack of confidence is often due to one thing: lack of structured learning. Free trading workshops can help a lot in that. Rather than relying on trial-and-error, beginners are given a chance to learn how the market operates, how professional traders think, and how disciplined investment decisions are made. An effective workshop is well organized so that participants can move from confusion to clarity and from reluctance to confidence. Why Most Beginners Lack Confidence in the Stock Market Many beginners believe successful traders are naturally talented. In reality, confidence is built through knowledge, practice, and proper guidance. Most new market participants struggle because they: Without proper education, every market movement feels uncertain and stressful. This is why structured free trading workshops have become increasingly popular among aspiring traders and investors. How Free Trading Workshops Build Market Confidence A good workshop is much more than simply imparting technical ideas. It helps participants gain the confidence to make informed decisions in the market. Learn Before You Risk Real Money One of the biggest advantages of attending a workshop is the ability to learn important concepts before putting capital at risk. Participants gain exposure to: This reduces the chances of making costly beginner mistakes. Understand How the Market Actually Works Many beginners think the market is unpredictable because they have never learned how prices move. Professional workshops explain: This creates a much stronger understanding of market behavior. Gain Confidence Through Structured Learning Organized learning brings about clarity. Workshop participants do not read at random; they can use a map to deepen their understanding of the market. This brings about efficiency in learning and confidence is developed naturally with time. Learn from Experienced Market Professionals Learning directly from experienced professionals helps eliminate many misconceptions that beginners develop from social media and unreliable sources. Expert guidance allows participants to: This significantly improves confidence and decision-making. Build a Disciplined Trading Mindset Confidence should never come from luck. It should come from preparation and discipline. Strong free trading workshops teach participants how to: This mindset is essential for long-term success. Understand Risk Before Chasing Profits Many beginners focus only on profits while ignoring risk. Professional traders think differently. They focus first on protecting capital and managing risk effectively. Workshops help participants understand: This creates healthier market habits and stronger confidence. What You Will Learn in Aceink’s Free Trading Workshops The workshop by Aceink is structured so that participants can learn about both trading and investing in a beginner-friendly, practical way. Swing Trading Strategies for Consistent Opportunities Swing trading allows traders to capture short-term market movements without constantly monitoring charts. Participants learn: Intraday Trading Setups Used by Active Traders Intraday trading requires structure and discipline. The workshop explains: Short-Term Investing Approaches Long holding periods are not necessary in all opportunities. Respondents are taught about the importance of short-term investment strategies in order to learn how to recognize opportunities and at the same time, manage risks appropriately. Long-Term Multibagger Investing Framework Long-term wealth creation often comes from identifying quality opportunities early. The workshop covers: Proven Trade Setups Used in Real Markets The workshop is based on the practical market training and not the abstract ideas. The participants are taught effective trade arrangements that can make their decision-making easier and help them gain a better understanding of the market. Easy-to-Use UP-Trend and Down-Trend Indicators Trend identification is one of the most important skills in trading. The workshop explains how traders can use simple trend indicators to: How to Use AI for Trading and Investing Artificial Intelligence is becoming an increasingly valuable tool for traders and investors. Participants learn how AI can help with: This modern approach helps traders work more efficiently. Risk Management and Market Psychology Many traders fail because of poor emotional control rather than poor strategies. The workshop helps participants understand: How to Find High-Potential Stocks Early The workshop is not about complex theories but, rather, practical market education that the participants can comprehend and put into practice. Learn Stock Market Trading & Investing for FREE with a SEBI Registered Research Analyst Aceink’s Free Workshop is conducted under the guidance of Bharath Shankar, a SEBI Registered Research Analyst (SEBI RA). The workshop is designed to simplify stock market learning for: Why Aceink’s Free Trading Workshops Are Different Aceink believes that stock market education should be practical, simple, and accessible. Participants benefit from: Who Should Attend These Free Trading Workshops? The workshop is ideal for: Conclusion Trust in the stock market is not constructed by watching some random videos or listening to tips. It is developed through organized education, experieance, and appropriate guidance. This is why free trading workshops have emerged as one of the best ways to introduce beginners to the stock market. They offer a secure space to study, inquire, understand market dynamics, and gain confidence before making significant financial decisions. The Free Workshop offered by Aceink provides that opportunity. The workshop, organized by SEBI Registered Research Analyst Bharath Shankar, is aimed at teaching the participants to learn how to trade and invest in the stock market free of charge through hands-on training in swing trading, intraday trading structures, long-term investing, artificial intelligence-driven market research, risk management, market psychology, and stock selection methods. Whether you are new to the market entirely or you are interested in sharpening your trading and investing expertise, this free workshop will help you gain confidence and knowledge in making smarter decisions in the market. Enroll now and take a step towards becoming a more knowledgeable trader and investor.
Handling Trading Drawdown: What to Do When Strategy Stops Working
Any trader goes through rough times in the market. A plan that is working suddenly ceases to yield results, trust begins to decline, and emotional stress builds after several failures. This is known as a Trading Drawdown, and it is one of the most difficult periods in a trader’s career. The majority of novices believe that there are no losing phases in successful traders. The situation is quite the opposite. Experienced traders experience drawdowns as no strategy is effective in every market environment. The actual distinction lies in how disciplined traders respond during a drawdown. Emotional traders panic, overtrade, and further erode their confidence. Strict traders are analyzers, adaptors, and decision-makers. Learning to handle a Trading Drawdown is of utmost importance for long-term survival and consistency in trading. What is Trading Drawdown? A Trading Drawdown is defined as the reduction in trading capital relative to past high points resulting from a series of losses or poor trading. To illustrate, when a trader’s account increases from 1 lakh to 1.5 lakh and then decreases to 1.2 lakh, the drop from the highest point is referred to as a drawdown. Drawdowns are inherent in trading because markets are ever-changing. There are no strategies that will generate profits permanently without having tough times. Why Trading Strategies Stop Working Temporarily A drawdown of activities panics many traders, since they think that their plan has been permanently unproductive. As a matter of fact, the market conditions might have just changed in the short term. Changing Market Conditions Breakout strategies can work well in trending markets but will fail in flattening markets. Likewise, momentum strategies can falter in low-volatility settings. During losses, several emotional trading errors can occur. Emotional Trading Mistakes During Losses One of the biggest reasons drawdowns become worse is emotional decision-making. After a few losses, traders often: These emotional trading errors tend to exacerbate the drawdown. Technical Analysis Mistakes Traders tend to give up their initial trading process entirely during hard times. The typical errors in technical analysis are: This minimizes the quality of setup. Why Losing Streaks Affect Traders Mentally A long losing streak in trading has a significant impact on confidence, as one becomes frustrated and doubts oneself after incurring losses repeatedly. The wisdom of many a trader starts to ask: This mental stress leads traders to give in to discipline altogether. Trading Psychology During Drawdowns During challenging periods in the market, strong trading psychology is critical, as emotional pressure is very high. Fear After Consecutive Losses There are several traders who hesitate to make more losses and miss out quality setups due to a lack of confidence, which occurs after making several losses. Revenge Trading Behavior Other traders attempt to make fast recovery by aggressive trading, which normally induce bigger errors and greater losses. Overtrading Losses Increase Further Damage When traders experience emotional drawdowns, they tend to embark on a mission to make unnecessary trades without proper confirmation. The unnecessary damage that such overtrading losses cause is typically very high, since the quality of decision-making is significantly degraded. What to Do During a Trading Drawdown Proper management of drawdowns entails control, patience, and analytical thinking rather than emotional response. Reduce Position Size Immediately Unless there is a major reversal in the Trading Drawdown, one of the clever things to do is to downsize the trade temporarily. Less risk exposure assists traders: This makes the recovery process more stable. Review Your Trading Journal Carefully Traders should not make emotional accusations of the market, but they should objectively analyze recent trades. Review: This will determine whether it is a strategy or execution problem. Focus on Trading Discipline Instead of Profits When the times are tough, making money fast should not be the focus, rather, restoring process discipline should be. Good discipline in trading implies: Discipline is what will bring about consistency, and not emotional recovery. Understand That Drawdowns Are Normal Many traders think that a drawdown is a failure. As a matter of fact, every professional trader goes through hard times. The market is dynamic and is acting out of course in the short term. Knowledge of this helps merchants keep their emotions in check. Avoid Strategy Hopping Repeatedly switching strategies after a couple of losses is one of the biggest errors traders make when they hit a Trading Drawdown. This is confusing, since traders do not give any system a chance to prove itself across various market conditions. Improve Risk Management in Trading Effective risk management in trades is even more critical in losing periods. Serious traders are concerned with: This helps prevent small drawdowns from becoming disastrous. Focus on Trading Recovery Gradually The process of trading recovery is slow and disciplined, not a violent emotional execution. They should continue to focus on: Slow growth adds greater stability in the long run. Why Stock Market Learning Never Stops Each setback is a valuable lesson on how to act and how not to act in the market, and how to adapt to changing strategies. This is why even experienced traders should continue learning in the stock market. Industrious merchants never cease to get better: This is an ongoing learning process that enhances trading consistency in the long run. How Aceink Helps Traders Improve Trading Consistency Aceink Free Sunday Webinar puts significant emphasis on real-life trading discipline, risk management and emotional understanding of the market rather than unrealistic trading expectations. Conducted by SEBI-registered Stock Market Analyst Bharath Shankar, the courses will enable the traders to learn: This is a practical solution to help traders develop healthier trading habits and emotional discipline. Why Trading Discipline Matters More During Drawdowns Anybody could be assured when the times are good. The actual trading maturity comes out in challenging times. Survivors of drawdowns tend to concentrate on: This attitude will distinguish emotional traders and serious market players. Conclusion The occurrence of a Trading Drawdown does not mean that trading cannot occur. It is a normal stage that every trader goes through at some stage. The actual
Live Stock Market Workshop to Understand Technical Analysis
Technical analysis is among the most significant skills that anybody who wants to trade or invest actively should have. It assists traders to know the market trends, opportunities, risk management, and make decisions based on price action and not on emotions. Yet, technical analysis is not an easy subject to learn among beginners. They do not only view the multiple videos and read the articles, they also learn dozens of indicators, but when a live chart appears in front of them they become confused. It is not the technical analysis that matters. The issue is studying subjects without any structure and real-life instructions. This is where a live stock market workshop comes in handy. Traders do not have to acquire some random ideas about various sources, but they have a chance to learn the technical analysis step-by-step within a practical market education. Free Sunday Workshop by Aceink, run by SEBI Registered Research Analyst Bharath Shankar is aimed at enabling beginners and aspiring traders to learn technical analysis in an easy, organized and practical manner. Why Technical Analysis is Important in Stock Market Trading Technical analysis assists traders to know the way prices fluctuate and the market trends forming. Traders study, rather than depending on news, opinions, or market rumors, technical analysis: This establishes a more orderly manner of participating in the market. Why Most Beginners Find Technical Analysis Difficult The biggest mistake many traders commit is that they want to begin with the advanced indicators and complicated strategies without knowing the basics. Common challenges include: An organized live stock market workshop can be used to counter these issues through putting emphasis on real life knowledge rather than needless complexity. How a Live Stock Market Workshop Improves Learning Taking technical analysis in a live workshop can be a highly different experience than just reading haphazard information on the internet. The participants are able to learn about concepts in combination as opposed to learning them separately. Learn Concepts Step-by-Step Proper learning sequence can enable the traders to establish good foundations. Participants are taught instead of going directly to advanced strategies: This develops superior long-term insight. Understand Real Market Behavior Technical analysis is simpler in circumstances where the traders know how markets act under various circumstances. A live workshop will assist in learning: This real-world knowledge enhances trust to a great degree. Gain Clarity Through Structured Education Structured learning is one of the greatest advantages of a live stock market workshop. The participants do not have to put together the information that is found in various sources any longer since concepts are elaborated in a logical order. What You Will Learn in Aceink’s Live Stock Market Workshop The workshop conducted by Aceink is aimed at making traders understand technical analysis in a practical manner, other than over-theorizing them with technical theories. Technical Analysis Fundamentals Participants are introduced to such blocks of technical analysis as: These are the concepts underlying chart reading. Chart Reading Made Simple A lot of traders fail due to their ignorance on how to interpret charts. The workshop eases the reading of charts by ensuring that the participants learn: This simplifies the chart analysis and makes it more feasible. Support and Resistance Analysis Support and resistance are still one of the strongest concepts of technical analysis. Participants learn: This assists traders to understand the market a lot better. Swing Trading Strategies Swing trading enables traders to utilize mid-term opportunities without constantly watching charts. The workshop explains: Intraday Trading Concepts The participants are also taught the way active traders target intraday opportunities. Topics include: Trading Psychology and Discipline This does not just happen through the use of technical analysis. Successful traders know also: This assists participants to be healthier in their market practices. Risk Management Principles One of the most important topics covered in the workshop is risk management. Participants learn: High risk management helps in long term participation in the market. Learn Stock Market Trading & Investing for FREE The workshop offered by Aceink does not just focus on technical analysis but also introduces the participants to practical concepts of trading and investing. The workshop covers: Swing Trading Strategies Acquire systematic techniques of recognizing short-term market opportunities. Intraday Trading Setups Learn the way active traders think about the daily movements of the market. Short-Term Investing Understand real-life strategies of finding short-term investments. Long-Term Multibagger Investing Know the principles of determining long-term growth opportunities. Learn to Trade and Invest Like Institutions One of the unique aspects of Aceink’s workshop is helping participants understand how experienced market participants approach decision-making. Key topics include: This will assist participants to create a more organised market view. Why Learn from a SEBI Registered Research Analyst Bharath Shankar, a SEBI Registered Research Analyst conducts the workshop. This offers the participants access to market education that are structured around: It is focused on education and making informed decisions as opposed to unattainable expectations. Who Should Attend This Live Stock Market Workshop? The workshop will be appropriate in: People who are fascinated by the stock market learning. The workshop is practical regardless of whether one is new in the market or seeking to enhance the current abilities. How to Join Aceink’s Free Workshop Getting started is simple. Individuals will be able to enroll in the workshop and start studying the concepts of the stock market in a formal setting. The workshop is held weekly on Sundays and is established to enable the technical analysis and market education to be available to all who are interested in trading and investing. Conclusion With practical explanation of concepts in a systematic and real market situation, learning of technical analysis becomes a lot easier. The reason is that most novices fail to make it since they create grand strategies before establishing very strong basics in chart reading and market behaviours. The live stock market workshop gives the framework, role models and real-world insights to build trust in trading and investing. Participants can develop a more robust perception of the working of
Best Webinar to Learn Stock Market Trading in India
In India, over the past couple of years, millions of new investors have joined the stock market. Individuals are becoming increasingly fascinated by trading, technical analysis, and opportunities to create wealth. Yet, despite increased attention, the majority of novices are left alone due to a lack of knowledge about where to begin and how to learn effectively. They watch random trading videos, follow social media tips, and attempt to use complex strategies without first learning the market structure. This does not build confidence but confusion. This is precisely why it is crucial that novices identify the appropriate platform for learning stock market trading. Structured webinars can make stock market concepts easier to understand, enhance technical knowledge, and help traders develop disciplined market habits from the very start. The Free Sunday Stock Trading Webinar conducted by Aceink is aimed at this purpose, as it is tailored to assist both beginner and developing traders to understand stock market trading in a simplified and practical manner. Why Most Beginners Struggle to Learn Stock Market Trading Most beginners in the stock market are unprepared and enter emotionally. Common mistakes include: Trading is incongruent and unstructured without structured learning. Why Structured Trading Education Matters The stock market is not difficult when its concepts are learned step by step. When traders feed on bits of information without understanding the relationships between concepts in real-life situations, the problem starts. Formatted webinar assists novices: This provides a stronger foundation of learning. What Makes a Trading Webinar Valuable? Not all webinars are beneficial to traders. There are sessions devoted to hype or unrealistic expectations rather than to reality about markets. The ideal webinar to study stock market trading should include the following: This is a long-term enhancement achieved through this practical way of learning. Why Aceink’s Webinar is Becoming Popular Among Beginners The webinar of Aceink is aimed at assisting traders in comprehending the market in a more practical way, rather than simplifying the ideas. The stock trading webinar, by SEBI-registered stock market analyst Bharath Shankar, enables beginners, working professionals, and traders to learn the stock market systematically and without confusion. They are not focused on notorious, unrealistic promises or on complex jargon but on practical market knowledge and rigorous education. What You Learn in Aceink’s Webinar The Sunday webinar by Aceink helps amateurs develop superior technical and practical knowledge of the market, step by step. Learn Technical Analysis in a Simplified Way Technical analysis can be cumbersome because a novice attempts to learn too much at once. The webinar simplifies concepts like: This helps traders become increasingly confident in reading charts. Learn Real Chart Reading with Practical Examples Most traders have theoretical knowledge but cannot analyze live charts on their own. The webinar by Aceink assists traders in realizing the following: This is a practical way of enhancing clarity in the market. Understand Breakout and Pullback Trading Concepts Some of the most popular trading strategies are breakout and pullback strategies. The webinar explains: This brings about better setup comprehension. Learn Risk Management Before Aggressive Trading Among the largest causes of traders’ failure is a lack of risk management. The webinar of Aceink is highly geared towards educating traders to know: This would establish healthier trading practices at the outset. Trading Psychology and Emotional Discipline Emotions are significant in trading performance. The webinar also assists the traders to know: This realistic awareness enhances consistency in trading in the long-run. Why Sunday Webinars Help Traders Learn Better Aceink has scheduled its webinars on Sundays so that participants can study at a relaxing pace without the disturbances of live markets and stress. Sunday sessions help traders: This learning framework is reliable and helps traders develop over time. Learn from SEBI-registered stock market analyst Bharath Shankar Practical guidance from Bharath Shankar, a SEBI-registered stock market analyst specializing in disciplined, structured stock market learning, is one of the webinar’s strongest benefits. The webinar is also aimed at assisting the traders in comprehending the real market performance, concepts of technical analysis, and disciplined execution as befitting the Indian market environment, instead of encouraging the shortcuts of trading. Who Should Attend This Webinar? Aceink’s webinar is ideal for: The webinar makes learning the stock market a real, simple task, one that is easy for beginners to understand. Why More Traders Are Choosing Aceink to Learn Stock Market Trading Clarity, discipline, and practical understanding are among the aspects that many traders seek in Aceink’s webinars, rather than in market-hyped topics. Participants appreciate: This provides a much more powerful learning environment for novices. Why Online Trading Webinars Are Growing Rapidly in India The increased availability of online learning has boosted its popularity, as more people can now enhance their stock market knowledge wherever they are without changing their schedules. Webinars online assist traders: This has made webinars one of the fastest-growing modes of learning in the stock market. Conclusion Trading can be learned so much more easily when it is explained in a practical manner rather than overdone with too much theory and failing to meet expectations. The problem with most beginners is that they get into the market without learning or guidance. Even Aceink’s Sunday webinar, conducted by SEBI-registered stock market analyst Bharath Shankar, enables traders to learn stock market trading through practical education in technical analysis, chart reading, breakout analysis, risk management, and disciplined trading psychology. As a beginner with limited knowledge of the stock market, the free webinar offered by Aceink is a good way to start learning, with no initial registration fee and highly structured, user-friendly instruction.
Free Stock Market Classes Online for Beginners

When beginners are properly guided, given practical education, and provided with simplified knowledge of technical analysis, it is much easier to learn the stock market. The problem is that most people fail to learn to trade by randomly watching videos, following tips on social media, and absorbing other bits of information on the internet without a cohesive roadmap. This is precisely why novices are finding structured, beginner-friendly free stock market classes online easier to use to learn the stock market step by step. Aceink has emerged as a favorite learning medium for beginners seeking hands-on chart-reading training, technical analysis knowledge, and disciplined stock market learning without the need to decipher it. Aceink is headed by SEBI-registered stock market analyst Bharath Shankar, who specializes in helping beginners learn the real market in a practical manner through real-market education. Aceink: How to Enroll Free Stock Market Classes Online as a Beginner Free stock market classes online by Aceink are designed specifically for beginners who want to learn to trade in the stock market without getting lost in a jumble of unrealistic promises and complicated terms. The webinar aims to enable participants to build a solid foundation in stock market investing through simplified technical analysis education, chart reading skills, and disciplined trading insights. Beginner-Friendly Learning Structure Most beginners find it difficult because advanced concepts are taught too early. Aceink eases the learning experience in that it breaks down the stock market concepts step-by-step in a simple-to-understand manner. Practical Technical Analysis Education Rather than mere theoretical discussions, Aceink focuses on practical chart analysis and real-world market understanding to help beginners build confidence throughout the learning process. Learn from SEBI Registered Stock Market Analyst Bharath Shankar, a SEBI-registered stock market analyst specializing in disciplined and structured stock market education, leads the webinar. Weekly Sunday Learning Sessions Aceink also offers free stock market classes online on Sundays, enabling beginners and busy people to learn without the distractions and pressures of the market. Focus on Real Market Understanding The free stock market classes online aim to help beginners first learn how the real market behaves rather than basing their trading on arbitrary advice or emotion. Top Stock Market Concepts You Will Learn in Free Stock Market Classes Online for Beginners Aceink’s free online stock market classes cover key concepts to help new investors build a solid understanding of the market and gain confidence in trading. Technical Analysis Fundamentals One of the most valuable skills of traders and active investors is technical analysis. The webinar assists beginners in learning: This provides a solid foundation for learning about the stock market. Support and Resistance Understanding The concepts of support and resistance are some of the strongest in technical analysis. The participants will be taught the way these zones benefit the merchants: This helps beginners better understand the market structure. Trend Analysis and Market Direction Knowledge of the trend direction is essential to trading in the stock market. The webinar explains: This greatly enhances chart-reading confidence. Candlestick Pattern Understanding Candlesticks Pattern help traders understand buyer and seller behavior in the market. The concepts are simplified in the webinar. This is real-life learning that helps beginners analyze charts more easily. Breakout Trading Concepts One of the most popular market strategies is breakout trading. Aceink’s webinar helps beginners understand: This field experience enhances the quality of setups. Pullback Trading Strategies The use of pullback trading enhances traders’ ability to identify better entry points and manage risk. Participants learn: This establishes better-organized trading knowledge. Risk Management and Capital Protection One of the most significant subjects that are not taken into consideration by beginners is risk management. The webinar is heavily geared towards assisting participants to comprehend: This leads to healthier, more disciplined trading habits. Trading Psychology and Emotional Discipline Trading is influenced by emotions. The video tutorial assists novices in comprehending the following: This enhances trading behavior greatly. Real Chart Reading with Practical Examples The webinar by Aceink provides practical examples of reading charts to help beginners better relate theory to actual market behavior. This practical practice is much better at increasing our knowledge than purely theoretical education. How to Enroll in Free Stock Market Classes Online for Beginners? No fees required to join the free stock market classes online by Aceink. Follow these steps to enroll: All the information about the free webinar is on this page. Check Webinar Timing and Session Details so you don’t miss out. Important webinar details are also available on the landing page, including: Conclusion With a structured, practical approach to learning, beginners will find learning the stock market much easier than relying on random internet information or making emotional trading decisions. This is why most traders fail to succeed: they are not given proper guidance and education in the step-by-step learning of the stock market. The free stock market classes online offered by Aceink to beginners help participants learn about technical analysis, chart reading, breakout trading, risk management, trading psychology, and how to analyze fundamental market behavior in a simplified, beginner-friendly manner, held every Sunday. Aceink was founded by SEBI-registered stock market Analyst Bharath Shankar with the mission of helping beginners develop practical stock market knowledge through practical chart-reading training and rigorous market learning. Aceink’s free stock market classes online provide a solid baseline for starting your stock market journey, with no upfront registration fee.
Why Free Trading Webinars Help Beginners Learn Faster
The entry point for most beginners in the stock market is filled with excitement, yet very soon they become overwhelmed by the sheer amount of information online. Each platform educates various pointers, techniques, and market views. One individual discusses intraday trading, the next is selling options, and the rest of social media has haphazard stock tips and imaginary returns in the form of screenshots. This brings about misunderstanding rather than true knowledge. Novices take months of reading material to be unable to read charts with confidence or comprehend market action in practice. That is precisely why free trading webinars are emerging as one of the fastest-growing modes of learning among novice traders. Formatted webinars make stock markets easier to comprehend, organize learning systematically, and enable traders to learn the workings of the market step by step. Why Beginners Struggle While Learning Trading The majority of novices fail due to a lack of potential. Their learning process is completely unstructured, which makes them struggle. Common novice errors are: Learning in the stock market without guidance is confusing and inconsistent. Why Structured Learning Improves Trading Understanding Faster The stock market is a skill-based sector. Learning, like any other skill, is easier to learn when the concepts are presented in the right order. Structured free trading webinars help beginners: This makes learning faster and more effective. Learn Technical Analysis in a Simplified Way with Free Stock Market Webinar Technical analysis can be very challenging for a beginner, since they attempt to learn sophisticated indicators before learning basic charting. Free Trading Webinars for beginners will help them understand the concepts of technical analysis: This simplifies technical analysis by being practical. Real Market Examples Improve Learning Speed The ability to learn in a practical market by using real chart illustrations is one of the biggest benefits of free trading webinars. Novices learn more quickly when they are able to see: This real-world exposure enhances confidence more than theoretical learning. Webinars Remove Information Overload Most beginners are mentally drained from the overconsumption of scattered information every day. An organized webinar reduces the risk of confusion by addressing practical ideas that are most important to beginners. This will help traders stay more focused and learn more effectively. Learn Trading Psychology from the Beginning The biggest number of beginners tend to concentrate on strategies without taking into consideration emotions and discipline. Powerful free trading webinars will also make traders aware of: This psychological knowledge helps traders develop healthy trading practices at an early age. Learn Risk Management Before Aggressive Trading Many amateurs venture into trades without knowing how to protect capital. At Aceink, the structured Free Trading Webinars assist traders in stock market learning: This enhances risk awareness and reduces emotional trading errors. Why Free Learning Opportunities Matter for Beginners Those who want to join the expensive courses are not ready to join them immediately because many are interested in trading; they first have to know whether they are suited to trading. This is where free trading webinars come in so much since the novices can This provides a far more favorable starting point for beginners. Why Aceink’s Webinar Helps Beginners Learn Faster The Sunday webinar created by Aceink is aimed at making learning of the stock market easier to beginners and up-and-coming traders. The webinar, led by SEBI-registered stock market analyst Bharath Shankar, focuses on real-world market knowledge rather than theoretical complexities or market hype. What Beginners Learn in Aceink’s Free Trading Webinar Aceink’s webinar focuses on helping traders build a practical understanding of the stock market step by step. Technical Analysis Simplified Learn chart reading, trend analysis, support and resistance, and breakout concepts in beginner-friendly language. Real Chart Reading Understanding Understand how traders analyze live charts and practically identify stronger market setups. Breakout and Pullback Concepts Learn how disciplined traders approach breakout opportunities and pullback entries. Risk Management and Discipline Understand how stop-loss discipline and capital protection improve consistency. Trading Psychology and Emotional Control Learn why emotional discipline matters just as much as technical analysis in trading. Why Sunday Webinars Work Better for Beginners Aceink hosts its webinars every Sunday, allowing beginners to study without being distracted by ongoing market events or feeling emotional pressure. Sunday learning sessions aid participants: This regular weekly routine helps novices improve over time. Learn from SEBI-registered stock market analyst Bharath Shankar Practical learning by Bharath Shankar, an SEBI-registered stock market analyst dedicated to structured stock market education and a disciplined understanding of trading, is one of the most powerful benefits of the Aceink webinar. The webinar is not about shortcuts or unrealistic profits; it is about helping traders understand actual market behavior and realistic technical analysis tailored to the Indian market. Who Should Attend These Free Trading Webinars? The webinar of Aceink is suitable for: The classes would make it easier to learn to use the stock market and enhance confidence among beginners. Why More Beginners Are Joining Aceink’s Webinar Many traders are attending Aceink webinars because they do not involve unnecessary complexity, unlike some of its competitors. Participants appreciate: This provides a more comfortable and powerful learning atmosphere to beginners. Conclusion When concepts are taught in an organized, practical manner, learning the stock market becomes much easier. The biggest problem among beginners is that they do not start trading because they cannot do it, but because they are consuming information that is not focused and lacks guidance. Organized free trading webinars help traders build a stronger foundation, enhance technical analysis knowledge, and develop disciplined market behavior at an accelerated pace through practical learning and real-world chart examples. In the Sunday webinar by Aceink, conducted by SEBI-registered stock market analyst Bharath Shankar, beginners learn technical analysis, breakout trading, risk management, chart reading, and trading psychology through easy-to-follow, practical market education, with no initial registration fee.