
Best Online Webinar for Technical Analysis Learning
Technical analysis has emerged as one of the greatest assets to traders and active stock market investors in the modern stock market. Technical analysis contributes significantly to decision-making in markets, whether one is interested in learning chart patterns, trends, breakouts, how to enter and exit the market, or in the timing of the market. However, the biggest problem beginners face is learning technical analysis properly. Giving little to no thought to the foundation of reading charts, most individuals jump from haphazard videos, complicated signs, and incomprehensible tactics. They get information overload instead of being able to see clearly. That is precisely the reason why online learning in structured technical analysis is now highly relevant to novices as well as to individuals in the expanding ranks of traders. The Free Sunday Webinar by Aceink aims to enable traders to learn technical analysis in a simplified way, with real chart examples and disciplined market training under a SEBI-registered stock market analyst, Bharath Shankar. Why Most Beginners Struggle While Learning Technical Analysis Online Technical analysis material is abundant online, yet most novices still fail to take effective steps due to the lack of a systematic learning approach. Common problems include: This brings about confusion rather than real understanding. An online course-structured webinar makes learning technical analysis straightforward because the ideas are presented step-by-step. What is Technical Analysis? Technical analysis is a process that uses charts, price movements, and trends to analyze market behavior and identify potential trading opportunities. Traders use technical analysis to analyze the following: This helps make better trading decisions with enhanced market knowledge. Why Structured Technical Analysis Learning Matters Most traders attempt to go into the complex world of trading without knowing the fundamentals. This sets flimsy premises and unequal decision-making. Online learning of structured technical analysis assists traders to: This brings about greater market knowledge over the long term. What Makes Aceink’s Webinar Different? Aceink webinar emphasizes the real-world learning in stock market rather than irrelevant complexity. The sessions under the leadership of SEBI-registered stock market analyst Bharath Shankar will aim at enabling beginners and even growing traders to learn about technical analysis using real market logic, and will be explained in simple terms. Learn Real Chart Reading Instead of Memorizing Indicators Most traders can name the indicators but they end up being unable to interpret the charts. The webinar by Aceink allows traders to know: This is a practical method of enhancing the chart-reading skill. Technical Analysis Concepts Covered in the Webinar The Aceink webinar focuses on the technical analysis basics, presented in practical examples that are easy to understand. Trend Analysis Simplified Understand how upward, downward, and stalemate markets react in real life. Support and Resistance Understanding Know how traders can identify strong zones of support and resistance to improve market analysis. Candlestick Reading Concepts Get to know how candlestick movements indicate the activity of buyers and sellers at the market. Breakout and Pullback Analysis Learn how disciplined traders can determine breakout opportunities and pullback entries in practice. Volume and Momentum Understanding Discover how to use volume to confirm momentum and breakout strength. Why Real Market Examples Improve Learning Faster When traders cannot match reality with what the charts show, theory becomes challenging. The webinar offered by Aceink teaches beginners how to learn technical analysis online in a more comprehensible, realistic way through real-life examples. This helps traders: Field experience promotes learning very fast. Learn Risk Management Alongside Technical Analysis Long-term consistency requires more than just technical analysis. Another significant role of risk management is to conserve capital and enhance discipline. The webinar by Aceink also aids traders in learning: This establishes more healthy trading patterns at the start. Trading Psychology and Technical Analysis Connection Lots of amateurs do not realize how emotions influence the technical analysis decisions. The webinar discusses the impact of fear, greed, impatience, and emotional decision-making: This pragmatism enhances trading discipline. Learn from SEBI Registered Stock Market Analyst Bharath Shankar Practical learning by Bharath Shankar is one of the greatest strengths of the Aceink webinar as he is a SEBI Registered Stock Market Analyst specializing in disciplined and structured education in the stock market. The webinar is aimed at assisting Indian traders to comprehend the actual market dynamics, technical analysis principles and disciplined trading habits tailored to meet the needs of the Indian market, as opposed to realistic promises or trading in a shortcut manner. Why More Traders Are Choosing Aceink for Technical Analysis Learning Online Most merchants like the webinars of Aceink since the lessons are based on practical knowledge rather than complex terms and impractical ideals. Participants appreciate: This makes the learning environment far higher for novices. Why is Online Technical Analysis Learning Growing Rapidly? Technical analysis is becoming the favorite method of learning among more traders due to the flexibility and structured learning provided by internet-based learning. Online webinars help traders: This has rendered trading education over the internet among novices and the working classes very popular. Conclusion It is possible that technical analysis is far easier when the concepts are taught in a practical fashion, using real chart examples and simplified learning techniques. The biggest problem is that most beginners fail to do this because they attempt to learn advanced strategies without laying a solid foundation in the market. The Sunday webinar conducted by Aceink under the guidance of SEBI-registered stock market analyst Bharath Shankar helps traders learn technical analysis online through a practical chart-reading process, breakout analysis, support-resistance concepts, risk management, and becoming a disciplined market learner. For traders looking to enhance their technical analysis skills and gain real-world experience in the stock market, Aceink’s free webinar offers a well-organized, user-friendly learning experience with no initial registration fee.
Why Beginners Should Attend a Free Trading Webinar Before Investing
The majority of novices start in the stock market with a lot of enthusiasm, yet minimal practical knowledge. They begin watching random videos, following social media recommendations, and making investment choices without adequately understanding market behavior. After some emotional trades and puzzling losses, most people start to think that stock market trading is too risky or difficult. The fact is that the issue is not the market. The actual issue is that it becomes the market without systematic learning. And that is precisely why taking part in a free trading webinar before investing can utterly transform the learning process for beginners. An effective webinar will help traders develop a practical understanding of technical analysis, chart reading, trading psychology, and disciplined decision-making before committing emotional capital. Why Do Most Beginners Lose Confidence Quickly? Preparation, patience, and disciplined learning are rewarded in the stock market. Most novices, however, do not take the time to learn and instead dig directly into trading or investing. This tends to result in: Through a well-organized free trading webinar, beginners can prevent such pitfalls and make better market knowledge in the first steps. Learn Market Basics Before Investing Real Money Among the greatest benefits of viewing a webinar before investing is that beginners learn how the market functions in real life before risking their money. Traders are exposed to real world concepts like: This background will help newcomers to the market feel more confident. Learn Technical Analysis in a Realistic Way. Technical analysis can be very confusing to newcomers as they attempt to learn numerous indicators simultaneously before they have a solid grasp of the fundamentals. A realistic free trading webinar makes the technical analysis concept simpler because it dwells on concepts such as: This assists beginners in getting familiar with the behavior of charts rather than being a slave to indicators. Why Structured Learning Matters in Trading? The majority of amateurs absorb fragments of information over the Internet. One video educates on breakout trading, one video discusses scalping, and another video marketing promotes random indicators. This generates information overload rather than clarity. The learning process is structured as a free trading webinar so that beginners can learn step by step, make sense of concepts, and practically implement them in the market. Learn How Professional Traders Think Emotional beginners and professional traders trade in the market very differently. Instead of excitement, they delve into discipline, probability, and process. Process Matters More Than Prediction Seasoned traders also adhere to systematic procedures rather than attempting to predict all market trends. Risk Management Comes Before Profit Professional traders guard capital initially, since survival in the market is more important than a single profitable exchange. Patience Improves Trade Quality Serious traders do not push trades based on emotions; they wait for a good setup. Emotional Control Builds Consistency Many novice traders are ruined by fear and greed. Early development of emotional discipline results in healthier trading habits. Learn Risk Management Before Taking Trades One of the most significant notions beginners tend to disregard is risk management. Most traders are solely interested in making profits, disregarding the protection of their capital. The free stock trading webinar by Aceink is highly oriented towards guiding beginners to learn: This assists traders to be less emotional during trading. Why Trading Psychology is Important for Beginners The majority of amateur errors are emotional errors. Fear, greed, impatience, and revenge trading influence decision-making far more than beginners are aware. A systematic free trading webinar assists traders to learn: This enhances trading awareness in the initial stages. Learn Through Practical Market Examples Confidence is hardly ever generated through theory. Novices will learn much better when the concepts are explained using market examples and chart analysis. The webinar provided by Aceink is aimed at making the traders to realize: This is a practical learning style, which simplifies the conceptualization of the concepts. Why Aceink’s Free Trading Webinar is Beginner-Friendly The webinar offered by Aceink is exclusively for beginners interested in real-world knowledge about the stock market, without complex terminology or unrealistic claims. The sessions, under the leadership of SEBI-registered stock market analyst Bharath Shankar, aim to simplify stock market learning by providing structured education and real-life examples in the Indian market. What You Will Learn in Aceink’s Free Trading Webinar The Sunday webinar by Aceink helps beginners build a firm market underpinning based on a learning-centered conceptualization. Technical Analysis Simplified Study support-resistance, chart reading, trends, and the market structure in a simplified manner. Breakout and Pullback Concepts Know how traders find good setups and avoid poor markets. Risk Management and Capital Protection Understand the importance of disciplined risk management in order to survive in the market in the long term. Trading Psychology and Discipline Know how to control emotions, be patient and make decisions in trade. Real Market Chart Analysis Get to know real market examples to read the charts in a practical manner rather than just through theories. Why Sunday Webinars Work Better for Beginners Aceink hosts a free trading webinar on Sundays to help traders focus on their education without the pressure of the live market. Sunday sessions help participants: This weekly privilege can enable novices to improve gradually over time as they regularly learn about the stock market. Why More Beginners Are Joining Aceink’s Webinar A significant number of novices join Aceink’s webinar to learn the stock market in an orderly way rather than haphazardly amid internet bewilderment. Participants appreciate: This provides a realistic and accommodating learning experience to the novices. Conclusion Entering the stock market without proper preparation is likely to confuse, lead to emotional errors, and result in unwarranted losses. Novices who initially construct useful knowledge tend to be more confident and healthier in their trading habits as they mature. A free trading webinar organized before investing is an educational exercise that helps traders learn about technical analysis, market structure, risk management, and disciplined trading in a more practical, beginner-friendly manner. The Sunday webinar offered by the SEBI-registered stock market analyst Bharath Shankar
Technical Analysis Free Webinar Learn Real Chart Reading
Most beginners start learning technical analysis enthusiastically, only to be overwhelmed very soon. They see complicated indicators, confusing chart setups, and endless trading strategies online. Several dozen videos later, many traders still cannot find the right answer to a simple question: how to read a stock chart properly. This is because most individuals learn technical analysis on paper but never know how the charts will behave in the actual market. That is precisely the reason Aceink is offering a free, chart-reading, practical technical analysis webinar every Sunday to help traders learn to read charts in a simplified, beginner-friendly manner. The Stock Market webinar is conducted by the SEBI-registered stock market analyst, Bharath Shankar, wherein the main tasks are practical stock market knowledge, the learning of technical analysis, and the learning of disciplined chart-reading. Why Most Beginners Struggle with Technical Analysis Technical analysis is not hard in itself. The actual issue is the learning methodology. Many beginners: This is rather confusing than clear. These concepts are made step-by-step easy to understand with a structured technical analysis free webinar that enables the beginner to actually learn how charts work. What is Technical Analysis? Technical analysis refers to the study of charts, price movement, market trends and market behavior with the aim of comprehending the trading opportunities. Technical analysis aids traders in analyzing rather than just relying on news or opinion: This enhances the quality of decision-making and understanding the market. Why Real Chart Reading Matters in Trading? A lot of traders will be familiar with indicators names but will not be able to analyze a live chart. Learning the actual chart reading is significant due to the ability to grasp the following by traders: In areas where customers are dynamic. The absence of chart-reading skills will make the trading decision-making emotional and desperate. What You Learn in Aceink’s Technical Analysis Free Webinar The webinar created by Aceink aims to make beginners comprehend technical analysis in a realistic manner, rather than confusing them with the inappropriate amount of complexity. Learn How to Read Market Trends Clearly The most important component of technical analysis is trend understanding. The webinar assists traders in understanding: This forms a more solid market base. Understand Support and Resistance Properly One of the most influential concepts in chart reading is support and resistance. A free webinar on technical analysis offered by Aceink discusses how traders with such zones can: This practical knowledge enhances confidence in charts to a high level. Learn Candlestick Reading in a Simplified Way Candlestick discloses key market dynamics. The webinar educates traders on the ways to comprehend: Traders are taught the importance of candlesticks that indicate the activity of buyers and sellers rather than know patterns by heart. Breakout and Pullback Chart Analysis “Breakout” and “pullback” are terms that are regularly talked about by many traders but they are often not able to recognize them on live charts. Aceink’s webinar explains: This is a practical method to make traders examine charts more assuringly. Why Practical Learning is Important in Technical Analysis Most amateurs lose out as they acquire the technical information at the theoretical level without experiencing how the concepts work in the real market situation. The structured free webinar on technical analysis, which consists of practical chart use, assists traders in substituting theory with real-market behaviour. This simplifies learning and makes it more beneficial. Learn Risk Management Alongside Chart Reading Consistency does not just come as a result of technical analysis. Trading discipline involves a significant component of risk management. The webinar by aceink will assist traders to know: This initiates healthier practices in trading. Trading Psychology and Technical Analysis Connection Trading is closely linked with charts and emotions. The webinar also describes the influence of emotional behavior in making technical analysis decisions like: Learn from SEBI-registered stock market analyst Bharath Shankar Among the greatest strengths of the Aceink webinar is the learning session with Bharath Shankar, who is a SEBI-registered stock market analyst with a passion to offer practical and disciplined education on the stock market. Rather than false trading promises, the webinar is aimed at guiding traders to comprehend the real market dynamics, the notion of technical analysis and disciplined trading strategies, all to suit the Indian market environment. Conclusion Technical analysis is significantly simplified when taught in a practical manner, using real examples of chart reading rather than theory. This is a common pitfall, as most beginners attempt to learn indicators without first learning market structure and price behavior. In his Sunday technical analysis free webinar, Aceink, a manual of SEBI Registered Stock Market Analyst, Bharath Shankar, educates traders to learn how to read charts, perform breakout analysis, and understand concepts of support-resistance, risk management and disciplined trading behavior through learning in practical markets. For beginners seeking greater confidence in chart reading and a working knowledge of the stock market, Aceink’s free webinar offers a well-organized, beginner-friendly online study experience with no initial registration fee.
Online Stock Market Webinar with Live Market Examples
The failure of most beginners in the stock market is due to the fact that they learn only theory and never learn how trading concepts apply in the real market environment. They have viewed videos on support and resistance, trendlines, candlestick patterns, and breakout trading, but when they open a live chart, they become confused. It is in this area that practical learning plays a role. A live market webinar where traders view stock markets and observe actual chart behavior helps them relate technical concepts to the chart. Rather than memorizing the indicators without understanding, traders begin to learn how professional market analysis works in practice. This is precisely what the Sunday Aceink webinar is meant to be. The webinar is led by SEBI-registered stock market analyst Bharath Shankar and focuses on practical technical analysis, real chart reading, and disciplined learning in the stock market, using real market examples. Why Beginners Need Practical Stock Market Learning The majority of individuals invest in the stock market after watching random materials online. One of the videos instructs in scalping, another one advocates intraday tips, and another one suggests complex signals. This brings about confusion rather than clarity. It is not the shortage of information. The issue is the absence of organized learning and practice. An online stock market webinar is organized to enable the traders to learn how the concepts of the market act in the real trading environment rather than learning the definition theoretically. Learn Real Chart Reading Instead of Memorizing Theory Many novices are familiar with technical terms but struggle to read a chart smoothly. Practical chart reading is significant as it teaches traders to comprehend the following: This practical knowledge enhances market confidence at a higher rate than just learning theory. What You Learn in Aceink’s Online Stock Market Webinar The webinar by Aceink is designed to help traders make technical analysis easier and gain a better practical understanding of the market step-by-step. Understand Market Structure with Live Examples One of the most significant aspects of technical analysis is market structure. The webinar assists traders in having knowledge: Live examples enable traders to detect these structures more confidently. Learn Support and Resistance Practically One of the strongest notions in stock market trading is support and resistance. The online stock market webinar through Aceink explains the benefits of these zones to the traders: This realistic approach simplifies chart analysis for beginners. Technical Analysis Simplified for Beginners Technical analysis can seem complex because traders try to learn too many concepts at once. The webinar makes technical analysis easier by learning in a practical way, which concentrates on: The emphasis is not put on the more confusing chart-reading foundations. Learn Breakout Trading with Real Market Examples The breakout trading is one of the most used trading strategies, and most beginners experience problems with it since they are unable to distinguish between the strong and weak breakouts. The webinar explains: How breakout setups are considered by disciplined traders. This aids traders in enhancing the quality of the setup. Understand Pullback Trading Concepts After market movements, many traders enter trades out of emotion. The Aceink webinar makes traders aware of how trading with a pullback can be better: This leads to more organized trading options. Learn How Volume Supports Market Analysis Volume is important in technical analysis because it indicates market participation. The webinar explains: This enhances the understanding of the market in general. Why Live Market Examples Improve Learning Faster Without relating the concepts to actual market behavior, learning becomes cumbersome. A live webinar on the stock market using live examples assists traders: Learn Risk Management with Real Market Context The majority of inexperienced people are interested in profits but overlook a capital protection. The webinar of Aceink puts significant emphasis on assisting traders to realize that: This will lead to more disciplined, medical trading habits. Get Started With Stock Market Learning from SEBI-registered stock market analyst Among the most powerful pros of the Aceink webinar is the practical study by Bharath Shankar, a SEBI-registered stock market analyst, with a specific emphasis on structured stock market education and disciplined trading knowledge. Rather than unrealistic profit claims or random tips on the stock market, the webinar is based on assisting the traders to understand the actual market behavior, technical analysis and disciplined execution in line with Indian market behavior. Who Should Attend This Online Stock Market Webinar? Aceink’s webinar is ideal for: The webinar makes learning about the stock market simple and more practical to a beginner. Conclusion Learning in the stock market is much simpler when a concept is illustrated with practical examples rather than mere theoretical definitions. The problem is that most beginners fail to do so because they do not learn how charts act in real market conditions. A Sunday stock market webinar on technical analysis, breakout trading, chart reading, risk management, and trading psychology conducted by SEBI Registered Stock Market Analyst Bharath Shankar is a webinar conducted by Aceink, which lets traders learn the technical analysis, breakout trading, chart reading, risk management, and trading psychology with the help of live chart examples and practical learning in the stock market. To traders seeking to develop real market insights and build confidence in chart-reading, Aceink’s free webinar offers a systematic, easy-to-learn context with no initial registration fee.
Webinar to Learn Technical Analysis For Free from Scratch
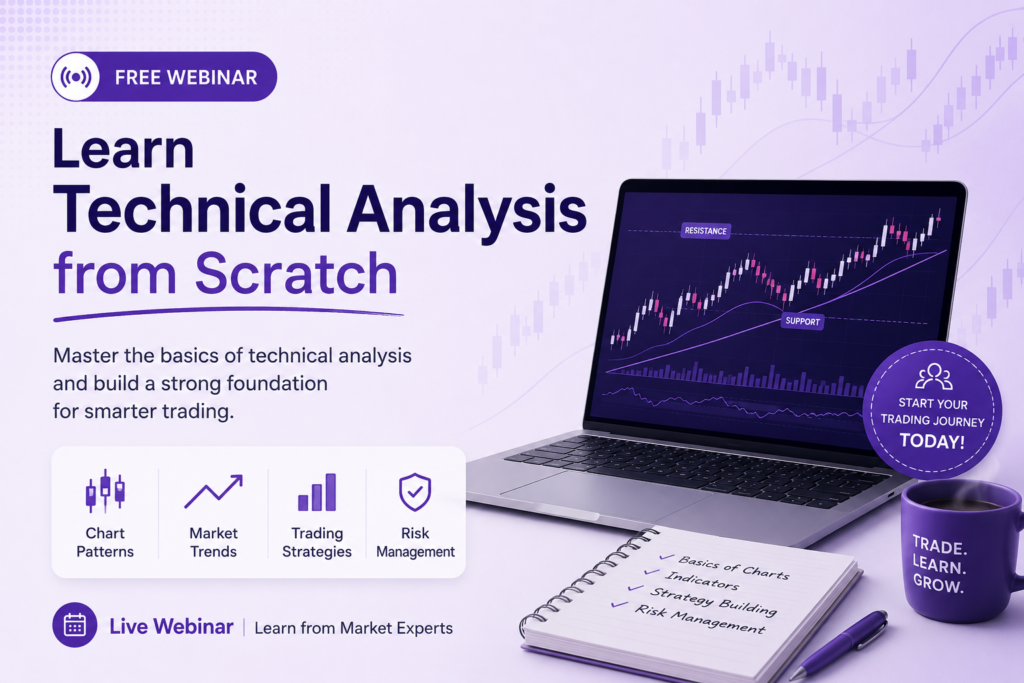
Many people are interested in learning to trade the stock market, but as soon as they begin studying technical analysis, they get confused. The charts appear complex, the indicators overwhelming, and the trading jargon is made to seem hard to comprehend. Due to this confusion, most beginners end up leaving prematurely or switching between randomly chosen strategies without developing actual knowledge. The fact is that technical analysis is not hard to learn, provided one knows how to do it from the start. Structured learning, simplified explanations, and practical market knowledge are what most beginners require. This is precisely why Aceink organizes the Free Sunday Webinar, designed for beginners to learn technical analysis for free in a practical, beginner-friendly manner. Under the leadership of SEBI-registered stock market analyst Bharath Shankar, the webinar aims to help traders build a solid foundation in chart reading, step by step. Why Beginners Struggle to Learn Technical Analysis? The greatest number of beginners attempt to learn technical analysis by reading random information on the internet without a roadmap. Common mistakes include: This brings about confusion rather than market practicality. Why Learning Technical Analysis from Scratch Matters? Chart reading and active trading are based on technical analysis. Traders tend to make emotional decisions because they cannot confidently interpret market behavior without the appropriate understanding. When amateurs study technical analysis correctly for free, they begin to comprehend the following: This creates stronger decision-making confidence. What is Technical Analysis? Technical analysis involves the study of price movements, market conditions, and chart patterns to gain insight into trading opportunities. As a substitute for news or opinions only, the traders study the following: This helps traders manage the market more systematically. What You Learn in Aceink’s Free Stock Trading Webinar The webinar offered by Aceink is designed to make the concepts of technical analysis as simple as possible, enabling novices to grasp the market in a practical manner without undue complexity. Learn Market Structure Step-by-Step One of the initial things novices should learn is market structure. The webinar assists traders in learning: This provides a stronger foundation when you learn technical analysis for free at Aceink. Understand Support and Resistance Properly The concepts of chart-reading that are of the greatest importance are support and resistance. The webinar by Aceink describes how these zones can benefit traders: This is empirical knowledge that enhances confidence in charts. Learn Candlestick Reading in Simple Language Candlestick patterns are usually confusing at first sight, yet they are far more comprehensible when put into practice. The webinar educates traders to learn technical analysis for free, and how to comprehend the following: This helps traders gain a better understanding of buyers’ and sellers’ activity. Breakout and Pullback Concepts Explained Practically Breakout and pullback are terms many beginners hear often, but they cannot use them on live charts. The webinar of Aceink assists traders learn technical analysis for free and adapt the following: This is an effective way of learning in practice, which enhances the quality of the setup. Learn Technical Analysis with Real Chart Examples Proper learning cannot be achieved through theory alone. The webinar by Aceink provides real-world chart examples to help beginners relate technical concepts to actual market behavior. It is easier to learn technical analysis for free with a better understanding and confidence. Learn Risk Management Alongside Technical Analysis Learn technical analysis for free with Aceink, which helps identify trading opportunities, while risk management safeguards traders emotionally and financially. The webinar is very keen on enabling novices to learn. This establishes healthier market practices. Understand Trading Psychology from the Beginning Emotions have a significant influence on trading decisions, particularly in new traders. The webinar also describes: This state of psychological awareness helps traders become increasingly consistent. Why Aceink Conducts the Webinar Every Sunday Sunday classes allow traders a chance to concentrate on the learning process without the pressures and interference of the live markets. The weekly webinar of Aceink assists participants to: Such a consistent learning environment helps novice learners improve over time. Learn from SEBI-registered stock market analyst Bharath Shankar The best thing about the webinar offered by Aceink is the practical learning with Bharath Shankar, a SEBI-registered stock market analyst specializing in disciplined, structured stock market education. The webinar is not about unrealistic promises or shortcuts; rather, it aims to help traders understand market behavior, technical analysis, and disciplined decision-making, with a focus on the Indian market. Who Should Attend This Webinar? Aceink’s webinar is ideal for: The webinar will simplify technical analysis and make it more accessible to novices. Why More Traders Are Joining Aceink’s Webinar Aceink is attracting a large number of traders to its webinars because the sessions focus on clarity and practical knowledge rather than technical jargon. Participants appreciate: This makes the learning environment a lot more powerful to beginners. Conclusion Technical analysis is much more palatable when explanations are presented in sequence, with practical chart examples, rather than as a complex theory. The problem with most beginners is that they attempt to learn some of the more advanced strategies without a solid foundation. The Sunday webinar by Aceink with the SEBI-registered stock market analyst Bharath Shankar will help traders learn technical analysis for free, including chart-reading training, breakout analysis, support and resistance, risk management concepts, and developing discipline in the market. For novices seeking to develop robust technical and practical stock market knowledge and skills, Aceink offers a free webinar with a well-organized, user-friendly learning environment and no fee.
Stock Market Learning Webinar for Working Professionals
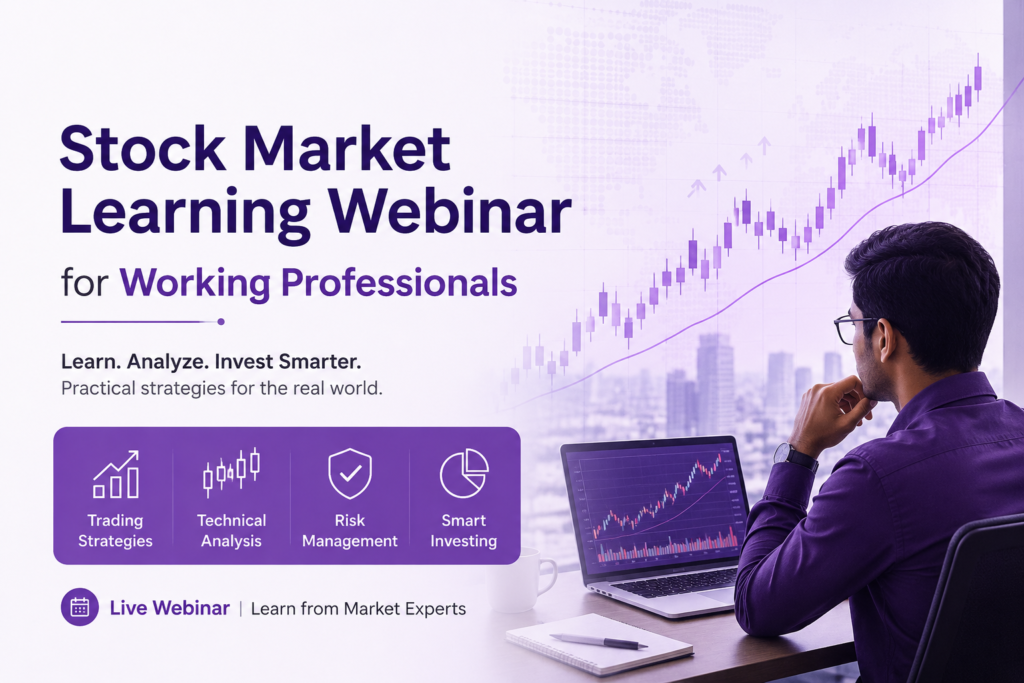
Most working-class individuals desire to study the stock market because they need another skill, improved financial knowledge, or an organized way to engage with the market. But the biggest challenge they face is time. Amid office hours, meetings, travel, and personal life, it is inconvenient to spend hours sitting through long courses in trading or watching any random videos on the internet. Consequently, most professionals either learn nothing or venture into the market without understanding. This is precisely why a stock market learning webinar can be so beneficial to working professionals, where there is structure to it. The Sunday webinar offered by Aceink aims to make the art of the stock market simple to learn by providing practical insight into both technical analysis and chart-reading, coupled with the stock market professionalism of a learning step-by-step approach, without getting confused. Why Working Professionals Are Interested in Stock Market Learning In recent years, the number of professionals who have ventured into the stock market has increased, as they seek to enhance their financial literacy and gain knowledge through participation in the market in a structured process. Many professionals are interested in: Nevertheless, the process of learning can be too daunting without guidance. Biggest Challenges Working Professionals Face While Learning Trading The majority of professionals do not have a problem due to an uninterestedness. Lack of time and lack of structured learning are among the factors that make them struggle. Common problems include: This is why having a stock market learning webinar that is beginner-friendly makes the learning process easier. Why Structured Webinar Learning Works Better for Professionals Employees in the workplace are more likely to be attracted to well-organized, practical, and time-conscious learning systems. A structured webinar is useful as it: Professionals no longer have to daily consume random material, but can acquire the stock market concepts in a more systematic manner. What You Learn in Aceink’s Stock Market Learning Webinar The webinar by Aceink will enable beginners and professionals to learn how to scrutinize the market in real life rather than going goofy and debating about the technical analysis. Learn Technical Analysis in a Simplified Way Technical analysis is often considered complicated because novices try to study too many indicators at once. The webinar makes understanding technical analysis concepts easy, like: This simplifies the process of chart reading and the work for professionals. Understand Real Chart Reading with Practical Examples Most amateurs are familiar with technical terms but lack the confidence to interpret charts. The stock market learning webinar by Aceink aims at assisting participants to learn: This practical chart-reading approach improves confidence gradually. Learn Swing Trading Concepts Suitable for Busy Schedules Many employed people are unable to monitor charts throughout the day due to work obligations. That is why the standard swing trading concepts that are easier to deal with and manage on a full-time schedule are also covered in the webinar. Participants learn: This makes trading more practical for professionals with limited time. Learn Risk Management Before Taking Trades Among the greatest mistakes beginners do is looking solely at profits and not thinking about the capital protection. The webinar by Aceink is particularly keen on ensuring that the traders get to know what it means to: This creates healthier trading habits from the beginning. Trading Psychology and Emotional Discipline The influence of emotions on trading decisions is not known by many beginners. The webinar will also assist professionals to know the following: Such working knowledge can be used to enhance the consistency of trading. Why Sunday Webinars Are Perfect for Working Professionals The reason Aceink holds a regular stock market learning webinar on Sundays is that it gives working professionals enough time to focus on the learning process without office pressures or market distractions. Sunday sessions help participants: This weekly structure makes learning more manageable and consistent. Learn from SEBI-registered stock market analyst Bharath Shankar A core strength of Aceink’s webinar is the experience of learning through Aceink, as taught by Bharath Shankar, a SEBI-registered stock market analyst specializing in theoretical, structured, and disciplined stock market training. Rather than vague market promises or a spectrum of jargon, the sessions are oriented towards realistic market knowledge, simplified technical analysis, and the concept of disciplined trading tailored to the Indian market. Who Should Attend This Webinar? Aceink’s webinar for stock trading masterclass is ideal for: The webinar is designed to make stock market learning practical and beginner-friendly. Why More Professionals Are Joining Aceink’s Webinar Many professionals are joining Aceink’s webinars because the sessions focus on clarity and practical understanding rather than confusing theory. Participants appreciate: This creates a much better learning experience for busy professionals. Why Webinar-Based Learning is Growing Rapidly Online webinar learning has become increasingly popular because it allows professionals to learn from anywhere without disrupting their work schedules. A structured stock market learning webinar provides the following: This makes stock market education easier to manage alongside professional responsibilities. Conclusion When concepts are presented in an organized, practical manner, learning the stock market becomes very easy. The majority of working professionals cannot succeed due to their potential rather than a lack of time-saving, novice-friendly market education. The Sunday stock market learning webinar by the SEBI-registered stock market analyst Bharath Shankar of Aceink helps professionals deepen their understanding of technical analysis, chart reading, breakout trading, risk management, and disciplined trading psychology by learning the market in a practical way. To gain more market knowledge without lengthy theory or impractical fantasies, Aceink offers a free online webinar with well-organized, practical learning resources, with no initial registration fee.
Beginner-Friendly Webinar to Learn Trading Psychology
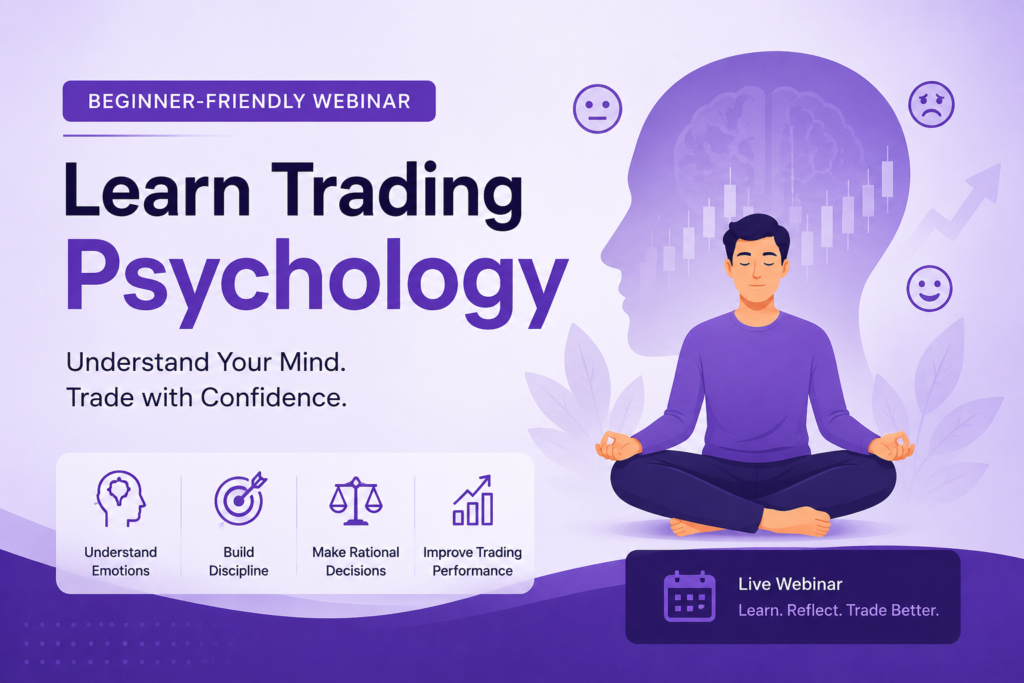
Most newcomers believe that all they need to succeed in trading is technical analysis, indicators, or identifying the ideal trading strategy. However, after a few days in the market, they come to realize that emotions are more likely to influence trading decisions than charts. Unconsciously, fear, greed, impatience, frustration, and overconfidence affect entries, exits, and risk-taking behavior. This is precisely the reason why numerous traders find it difficult, despite having some fundamental technical analysis knowledge. One of the most crucial aspects of being a disciplined trader is understanding market psychology. This is why Aceink organizes an introductory trading psychology webinar every Sunday to help traders understand how emotions influence decision-making and how disciplined traders approach the market in a practical way. What is Trading Psychology? The emotional and mental aspect of trading is known as “trading psychology.” It examines the impact of thoughts, emotions, and behavioral patterns on trading decisions. Strong trading strategies fail when traders: This is the reason why consistency cannot exist without technical knowledge. Why Most Beginner Traders Struggle Emotionally Trading involves uncertainty and risk. Money is involved, and thus, emotions are bound to be stronger. Many beginners experience the following: Such emotional responses undermine the quality of decisions without the right knowledge. Why Trading Psychology Matters More Than Most Traders Realize A trader may know chart patterns perfectly but still struggle because of emotional execution. For example: Such emotional errors usually do more harm than feeble technical analysis. This is why it is important to learn the psychology of trading to improve in the long run. What You Will Learn in Aceink’s Trading Psychology Webinar? The Aceink webinar on trading psychology aims to help traders learn the mental aspect of trading in a simplified, practical manner. SEBI-registered stock market analyst Bharath Shankar guides the webinar, which is aimed at helping beginners develop greater discipline, emotional control, and trading confidence. Learn How Fear Affects Trading Decisions One of the most powerful emotions in trading is fear. The webinar discusses the ways in which fear makes traders: Fear and knowledge can help traders make clearer decisions. Understand the Impact of Greed in Trading Avarice usually drives merchants into unwarranted speculations and passions. The webinar by Aceink assists traders in realizing the following: This brings about healthier trading behaviors. Learn Why Revenge Trading Destroys Discipline Having lost, many traders are trying to recover it quickly with impulsive trades. Such a practice is referred to as revenge trading. The webinar discusses the ways in which revenge trading generates: Knowledge of this behavior will enable traders to make rational decisions in the market without emotion. Emotional Discipline and Patience in Trading One of the least appreciated abilities in trading is patience. The webinar educates traders on the reasons why disciplined traders: This attitude enhances uniformity over time. Learn How Professional Traders Think Differently Professional traders will not be doing the same thing as emotional traders. The trading psychology webinar of Aceink assists beginners in knowing how disciplined traders concentrate on: This brings about enhanced trading transparency. Trading Psychology and Risk Management Connection Risk management and emotional control are closely related. Emotional pressure arises when traders take on too much risk with their money. The webinar explains: This helps traders feel more relaxed when approaching the market. Why Beginners Need Structured Psychology Learning Most amateurs focus on charts and neglect emotional discipline. This is why many traders know the technical concepts yet fail to be consistent. A systematic trading psychology webinar enables amateurs to grasp the psychological aspect of trading much sooner in the program. Why Aceink Conducts This Webinar Every Sunday The Sunday sessions are the ideal learning environment, as traders have the opportunity to learn in a serene setting without the pressure of the live market. Aceink’s Sunday webinar helps participants: This weekly learning format will enable the traders to develop better habits over time. Who Should Attend This Trading Psychology Webinar? The webinar of Aceink is suitable for: The webinar makes psychological concepts easier to understand in a more practical, user-friendly manner. Learn from SEBI-registered stock market analyst Bharath Shankar Among the best benefits of the Aceink webinar is the opportunity to learn from Bharath Shankar, a SEBI-registered stock market analyst who aims to provide an educational, practical approach to learning the stock market. Rather than generating unrealistic expectations, the webinar aims to help traders understand actual market behavior, emotional control, and organized decision-making geared towards long-term improvement. Why Traders Are Joining Aceink’s Trading Psychology Webinar A large number of traders are turning up for Aceink’s webinar because they understand that technical analysis will not yield the desired consistency. Participants appreciate: This will provide a more powerful learning process to traders with emotional problems. Why Trading Psychology is Important for Long-Term Success Emotional control and disciplined execution tend to be the keys to long-term consistency, and most traders are simply looking for the best strategy. Studying trading psychology can assist traders: This develops greater trading habits in the long run. Conclusion Charts and indicators are not the only keys to trading success. Emotional discipline contributes significantly to how traders make decisions, manage risk, and maintain consistency. The Sunday trading psychology webinar by Aceink, conducted by SEBI-registered stock market analyst Bharath Shankar, helps traders with the psychology of fear and greed, market discipline, and risk management, as well as the behavioral aspect of emotion trading, by providing market education in a simple and accessible way. For traders seeking to enhance their emotional management and develop a more robust trading mindset, Aceink’s free webinar offers an ideal learning experience in a well-organized, structured setting with no initial registration fee.
Learn Swing Trading in Free Stock Trading Webinar
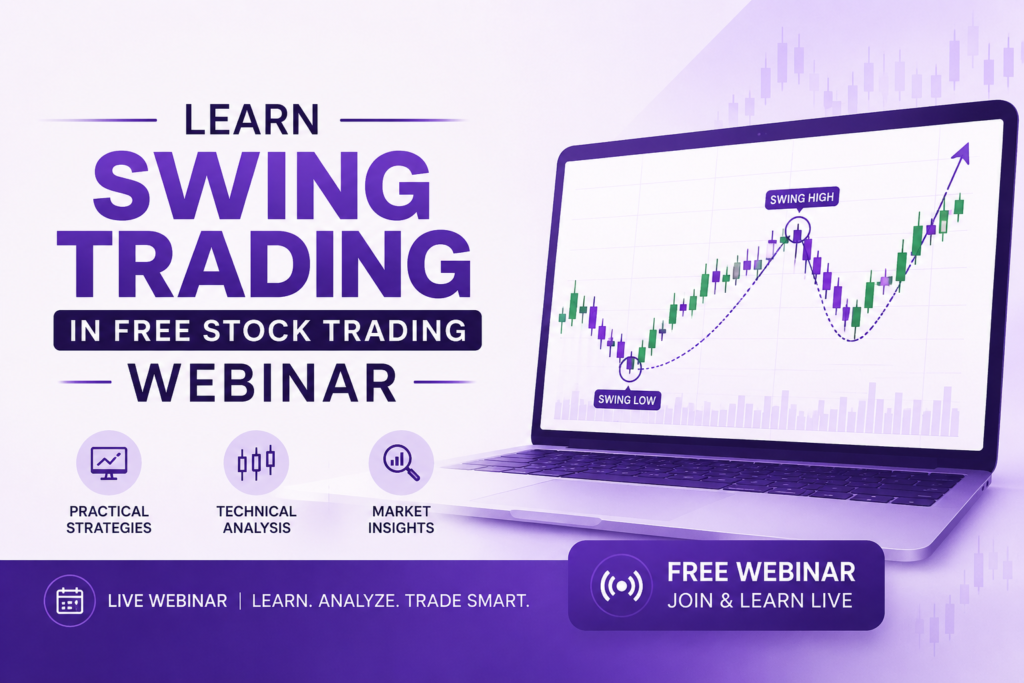
The swing trading strategy is one of the favored trading styles among beginners and professionals that falls between the extremes of intraday and long-term trading. Swing traders prefer to spend their day watching charts, rather than making long-term trades, and they make their short- to medium-term trades with proper planning and disciplined execution. So, the issue is that most traders at the beginning attempt to enter swing trading without properly educating themselves on trend structure, technical analysis, or risk management. They make trades based on their tips or feelings, end up losing money, and get confused. That is why Aceink runs a practical swing trading webinar each Sunday to let traders know what swing trading realistically entails in real market conditions. The webinar is conducted by SEBI-registered stock market analyst Bharath Shankar and focuses on practical learning, understanding technical analysis, and disciplined stock market education. What is Swing Trading Definition? A trading style that involves taking trades that are meant to take advantage of price action within a period of days to weeks. Swing trading is not about making very short-term trades or waiting years to accumulate investment gains, it is about finding good market momentum and setups. Typical characteristics of swing traders are: This is because swing traders are the ones who would like to have structured opportunities, but don’t have to stare at the charts all day. Why Swing Trading is Becoming Popular in India Many traders are shifting to swing trading as it’s more practical and balanced trading style. Swing trading allows traders to: That’s why a lot of beginners and working professionals are following the demand for practical swing trading webinar sessions. Why Beginners Struggle in Swing Trading Many newcomers go wrong in swing trading, not because it is a poor strategy, but because of their poor learning process. Common mistakes include: Even basic swing trading strategies can be problematic if they are not grasped. What You Will Learn in Aceink’s Swing Trading Webinar Aceink’s webinar focuses on helping traders understand swing trading in a simplified and practical way instead of overcomplicating technical analysis. Learn How to Identify Trending Stocks One of the most important parts of swing trading is stock selection. The webinar teaches traders how to identify: Understand Breakout Trading Concepts Breakouts are among the most widely used swing trading setups. Aceink’s swing trading webinar explains: This practical understanding improves setup quality significantly. Learn Pullback Entry Strategies Many beginners enter trades after large price moves and struggle with poor timing. The webinar teaches traders how pullback entries help improve: This creates more structured trading decisions. Technical Analysis Simplified for Swing Traders Technical analysis becomes much easier when explained practically. The webinar helps traders understand concepts such as: This helps beginners build confidence while analyzing swing trading opportunities. Risk Management for Swing Trading One of the biggest reasons traders struggle is poor risk management. Aceink’s webinar strongly focuses on helping traders understand: This helps traders develop healthier and more disciplined market habits. Trading Psychology and Discipline Swing trading requires patience and emotional control. The webinar also helps traders understand: This practical mindset helps traders gradually improve consistency. Why Aceink Conducts the Webinar Every Sunday Sunday is the best time for traders to focus on learning without market distractions and emotional pressure. Aceink’s Sunday trading webinar helps participants: This weekly structure helps traders improve gradually through continuous learning. Who Should Join This Swing Trading Webinar? Aceink’s webinar is ideal for: The intent of the webinar is to help demystify the market and ease the understanding of swing trading. Learn from SEBI Registered Stock Market Analyst Bharath Shankar The best part of Aceink’s webinar is that it provides practical advice from Bharath Shankar, a SEBI-registered stock market analyst dedicated to fostering disciplined market understanding. Unlike the futile promises and random stock tips that abound in the market, the webinar is all about practical market behavior, structured learning, and disciplined trading strategies tailored for Indian market conditions. Why Traders Are Joining Aceink’s Swing Trading Webinar Traders are coming to Aceink’s webinar because the webinar sessions do not include technical jargon that confuses traders, but are focused on clarity and understanding. Participants appreciate: This makes for a more meaningful and effective learning experience. Why Structured Swing Trading Learning Matters There are lots of traders out there who have been experimenting with swing trading for months with bits of videos on the web, but don’t know how trading strategies function in the real marketplace. A structured swing trading webinar allows traders to gain practical knowledge more quickly than they would by entering the trading field with unnecessary complexity and confusion. Conclusion With the right technical knowledge, disciplined swing trading and market structure analysis, swing trading can be a very powerful trading strategy. Most beginners struggle because they start trading without paying much attention to building practical foundations. In Aceink’s Sunday swing trading webinar, hosted by Bharath Shankar (SEBI-registered stock market analyst), traders gain insights into breakout trading, pullback setups, technical analysis, risk management, and disciplined swing trading strategies, while benefiting from real-world market education. If you’re seeking to develop a solid foundation in trading and swing trading in a more structured, user-friendly manner, Aceink’s webinar is an excellent place to begin, offering free, practical learning opportunities.
Sunday Live Trading Webinar by SEBI-Registered Analyst
The Indian stock market keeps expanding fast, yet the mess around learning to trade grows right along with it. Traders run into tons of videos, social media suggestions, and “sure-win” ideas every single day that leave them more mixed up than before. Most new traders struggle because they miss how actual market analysis happens in real time. They pick up on indicators easily enough, but the market structure remains unclear. They look at chart patterns, yet they never grasp how experienced traders stay cool and make sound decisions. This is the main reason Aceink runs a live trading webinar every Sunday. It gives traders a chance to pick up useful market ideas in a simple, step-by-step manner. SEBI-registered stock market analyst Bharath Shankar leads the session and keeps everything centred on genuine trading knowledge, clear technical analysis, and steady learning habits in the stock market. Why Traders Need a Live Trading Webinar Pre-recorded videos work fine for basic theory, but sitting in on a live session feels totally different. A live trading webinar lets traders see exactly how people apply market ideas in the moment, rather than just memorise fancy terms. New traders get to absorb trading ideas inside an organized setup that comes with clear examples and real logic from the market. This approach cuts down the stress, particularly for people who already feel buried under scattered tips floating around online. Learn from SEBI-registered stock market analyst Bharath Shankar The strongest part of Aceink’s webinar comes from Bharath Shankar’s direct input. As a SEBI-registered stock market analyst, he stresses hands-on methods and steady stock market training. The webinar walks traders through: The whole point stays on building real skills bit by bit instead of making big empty promises. What You Will Learn in the Sunday Live Trading Webinar Aceink’s webinar sticks to useful ideas that help fresh traders and those still growing get a much clearer picture of the market. Technical Analysis Simplified for Beginners Technical analysis seems tough when people try to juggle too many indicators at once. The webinar breaks it down by zeroing in on everyday concepts like: This style feels much more doable for people just starting out. Understanding Market Structure and Momentum The webinar shows traders how markets really shift and flow. People learn: Over time, this builds solid confidence when reading charts. Learn Breakout and Pullback Trading Concepts Breakout and pullback setups rank among the most common trading ideas out there. Aceink’s live trading webinar walks through the way careful traders catch these setups and steer clear of rushed or weak entries driven by feelings. Risk Management and Trading Discipline Lots of new traders chase profits hard while forgetting to guard their capital. The webinar puts real weight on: This builds smarter and steadier trading routines. Trading Psychology and Emotional Control Trading goes way beyond charts because feelings heavily influence every choice. The webinar helps traders get a handle on: This kind of straight talk lifts overall consistency in a big way. Why Aceink Conducts the Webinar Every Sunday Sunday gives traders the perfect window to learn without the rush of market hours or daily distractions. Aceink’s Sunday live trading webinar lets people: This weekly rhythm supports slow but steady growth through repeated exposure to useful stock market ideas. Who Should Attend This Live Trading Webinar? The webinar suits anyone who wants to get serious about better stock market knowledge. Beginners Starting Their Trading Journey If you just stepped into the stock market and prefer real direction over noise, this webinar lays down a solid base. Working Professionals Interested in Trading The webinar makes trading ideas easy to follow for busy people who still want organized learning. Traders Struggling with Consistency Many traders know the basics yet keep slipping on execution and control. The webinar clears up these exact gaps. Traders Wanting to Learn Technical Analysis Practically Anyone keen on reading charts and applying technical analysis gains a lot from this organized method. Why Traders Are Joining Aceink’s Live Webinar Traders keep showing up for Aceink’s webinar because it stays grounded in real market understanding and skips the usual hype. People like: Beginner-friendly explanations This down-to-earth style makes the lessons stick and easier to use right away. Common Beginner Problems the Webinar Helps Solve Aceink’s webinar tackles typical early headaches such as: This kind of clear help lets beginners face the market with more confidence. Why Live Learning Helps Traders Improve Faster Live sessions boost focus and real grasp because traders pick up ideas with actual examples and current market feel. A well-planned live trading webinar lets people ask good questions, see real cases, and gain greater confidence than jumping between random posts and videos online. Why Aceink is Becoming a Trusted Learning Platform Aceink works hard to move traders past scattered tips and knee-jerk choices. Guided by SEBI-registered stock market analyst Bharath Shankar, the platform delivers practical stock market training, steady technical analysis, and clear trading knowledge built for Indian conditions. The aim never pushes false dreams. It simply works toward creating smarter and more controlled traders. Conclusion Trading gets simpler once the teaching stays practical, well-organised, and tied to how markets truly behave. Most beginners trip up because they grab bits of info from everywhere without any clear path. Aceink’s Sunday live trading webinar guides traders through technical analysis, market structure, breakout trading, risk management, and a steady trading mindset using real examples led by SEBI-registered stock market analyst Bharath Shankar. For anyone looking to build stronger stock market skills through clear, step-by-step learning, Aceink’s free Sunday webinar is a smart place to begin, with no upfront registration fee.
Best Free Stock Trading Webinar for Beginners in India
Most beginners step into the stock market full of excitement but with almost no real understanding. They watch whatever videos pop up, chase tips from social media, and flip between different strategies without grasping how the market actually moves. After a few losses, the confusion piles up quickly, and many start to think trading is simply too complicated. It doesn’t have to be that way. Trading only gets difficult when the learning feels scattered and directionless. Beginners need clear, practical guidance, simple explanations, and a step-by-step view of how the market works. That’s why a solid free stock trading webinar makes such a big difference for anyone who wants to learn this the right way. A good webinar helps new traders dodge common mistakes, get a clear picture of technical analysis, and build real confidence before they risk money and start making emotional decisions. Why Beginners Need a Stock Trading Webinar Most beginners struggle because they try figuring everything out on their own. The stock market is packed with thousands of concepts, strategies, indicators, and different opinions. Without good direction, new traders often spend months jumping between random content and still don’t build any practical skills. A well-structured webinar makes learning much easier by zeroing in on the essentials: This approach builds a much stronger base to work from. What Makes a Stock Trading Webinar Truly Valuable? Not every webinar actually helps traders in real life. A lot of them stick to dry theory or make big, unrealistic claims. The best free stock trading webinar puts real market understanding first, not hype. Beginners gain far more from clear, practical insights than from complicated theory. A useful webinar helps traders: This kind of practical focus leads to lasting progress. Why Aceink’s Webinar is Becoming Popular Among Beginners Aceink designed its Free Stock Trading Webinar around a deep understanding of the market and straightforward technical analysis. The sessions skip heavy jargon and instead show beginners how the market behaves in a clear, structured way. The webinar is led by SEBI-registered stock market analyst Bharath Shankar and is designed specifically for beginners, working professionals, and traders who want clear, stock-market learning without all the confusion. What You Learn in Aceink’s Free Stock Trading Webinar Aceink’s webinar covers practical ideas that help traders gain confidence one step at a time. Understanding Market Structure Clearly You learn how trends develop, how momentum changes, and how overall market direction shapes trading chances. Technical Analysis Simplified for Beginners The sessions explain chart concepts in an easy-to-follow way so traders can grasp technical analysis without getting lost in unnecessary details. Breakout and Pullback Trading Concepts You discover how experienced traders spot breakout setups and pullback opportunities using straightforward market logic. Support and Resistance Learning Learn how support and resistance levels help you make better decisions about entries, exits, and risk management. Trading Psychology and Emotional Discipline Emotional decisions cause many traders to fail. The webinar shows beginners how calm, disciplined traders approach the market. Risk Management Understanding Protecting your capital is a major focus because consistent trading starts with strong risk management. Why Beginners Prefer Free Stock Trading Webinars Before Paid Courses Many beginners don’t want to pay for an expensive course right away. They prefer to get clarity about trading and the market first. A free webinar lets traders: This is why demand for the best free stock trading webinar keeps growing among beginners in India. Every Sunday Live Webinar for Continuous Learning Aceink runs its Free Stock Trading Webinar every Sunday so traders can learn consistently and build their market understanding over time. The Sunday sessions give traders a chance to: This regular weekly format helps beginners make steady progress instead of learning in a scattered way. Who Should Join Aceink’s Webinar? Aceink’s webinar works well for: The sessions keep things simple and make stock market learning much more practical. Why Learning from a SEBI-Registered Stock Market Analyst Matters A big strength of Aceink’s webinar is learning from Bharath Shankar, a SEBI-registered stock market analyst who focuses on practical, disciplined education. Instead of empty promises or quick-fix ideas, the webinar helps traders build genuine knowledge in: This leads to more realistic and well-organized learning. Common Mistakes the Webinar Helps Beginners Avoid Many new traders keep repeating the same avoidable errors, such as: Aceink’s webinar shows traders how disciplined participation in the market actually works. Why Aceink’s Webinar Stands Out Many traders join Aceink’s webinar because it stays focused on clarity and practical understanding rather than hype. The sessions are built to help traders: This approach makes the webinar especially beginner-friendly. Conclusion Finding the best free stock trading webinar matters because good guidance can completely shift how beginners see the stock market. Most traders don’t struggle because they lack ability, they struggle because they don’t have structured help or a clear understanding of the market. Aceink’s Free Stock Trading Webinar breaks down trading concepts, technical analysis, and market behavior through practical weekly sessions led every Sunday by SEBI-registered stock market analyst Bharath Shankar. For beginners who want to build confidence, read charts properly, and learn disciplined trading one step at a time, Aceink’s webinar offers a strong starting point at no cost and with no hidden fees.