Many people are interested in learning to trade the stock market, but as soon as they begin studying technical analysis, they get confused. The charts appear complex, the indicators overwhelming, and the trading jargon is made to seem hard to comprehend. Due to this confusion, most beginners end up leaving prematurely or switching between randomly chosen strategies without developing actual knowledge.
The fact is that technical analysis is not hard to learn, provided one knows how to do it from the start. Structured learning, simplified explanations, and practical market knowledge are what most beginners require.
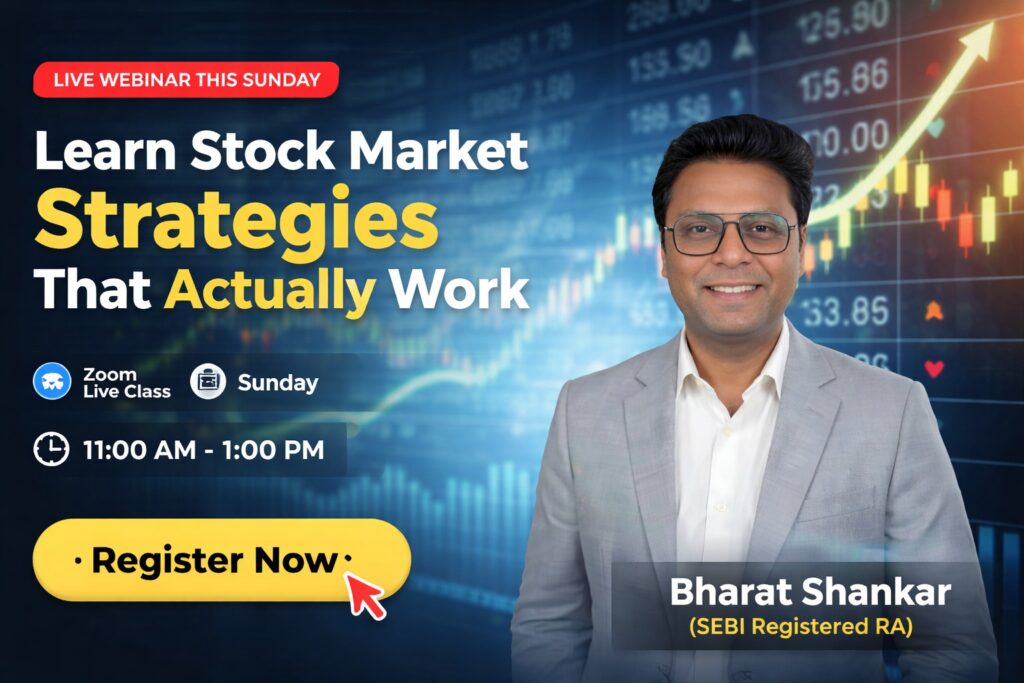
This is precisely why Aceink organizes the Free Sunday Webinar, designed for beginners to learn technical analysis for free in a practical, beginner-friendly manner. Under the leadership of SEBI-registered stock market analyst Bharath Shankar, the webinar aims to help traders build a solid foundation in chart reading, step by step.
Why Beginners Struggle to Learn Technical Analysis?
The greatest number of beginners attempt to learn technical analysis by reading random information on the internet without a roadmap.
Common mistakes include:
- Learning to know too many signs.
- Daily viewing of random trading videos.
- Pattern memorization without knowledge of price behavior.
- Ignoring market structure
- Taking trades without a proper understanding
This brings about confusion rather than market practicality.
Why Learning Technical Analysis from Scratch Matters?
Chart reading and active trading are based on technical analysis. Traders tend to make emotional decisions because they cannot confidently interpret market behavior without the appropriate understanding. When amateurs study technical analysis correctly for free, they begin to comprehend the following:
- How trends form
- How price moves
- How support and resistance work
- How change of momentum occur?
- How disciplined traders analyze setups
This creates stronger decision-making confidence.
What is Technical Analysis?
Technical analysis involves the study of price movements, market conditions, and chart patterns to gain insight into trading opportunities. As a substitute for news or opinions only, the traders study the following:
- Market trends
- Price action
- Support and resistance
- Momentum behavior
- Volume activity
This helps traders manage the market more systematically.
What You Learn in Aceink’s Free Stock Trading Webinar
The webinar offered by Aceink is designed to make the concepts of technical analysis as simple as possible, enabling novices to grasp the market in a practical manner without undue complexity.
Learn Market Structure Step-by-Step
One of the initial things novices should learn is market structure.
The webinar assists traders in learning:
- Uptrend behavior
- Downtrend structure
- Sideways market movement
- Trend continuation concepts
This provides a stronger foundation when you learn technical analysis for free at Aceink.
Understand Support and Resistance Properly
The concepts of chart-reading that are of the greatest importance are support and resistance.
The webinar by Aceink describes how these zones can benefit traders:
- Find good areas of entry.
- Understand breakout levels
- Improve stop-loss placement
- Analyze price reactions
This is empirical knowledge that enhances confidence in charts.
Learn Candlestick Reading in Simple Language
Candlestick patterns are usually confusing at first sight, yet they are far more comprehensible when put into practice.
The webinar educates traders to learn technical analysis for free, and how to comprehend the following:
- Bullish candles
- Bearish candles
- Rejection candles
- Momentum candles
- Market indecision behavior
This helps traders gain a better understanding of buyers’ and sellers’ activity.
Breakout and Pullback Concepts Explained Practically
Breakout and pullback are terms many beginners hear often, but they cannot use them on live charts.
The webinar of Aceink assists traders learn technical analysis for free and adapt the following:
- What strong breakouts look like
- How fake breakouts happen
- How pullback entries improve timing
- How trend continuation setups form
This is an effective way of learning in practice, which enhances the quality of the setup.
Learn Technical Analysis with Real Chart Examples
Proper learning cannot be achieved through theory alone. The webinar by Aceink provides real-world chart examples to help beginners relate technical concepts to actual market behavior. It is easier to learn technical analysis for free with a better understanding and confidence.
Learn Risk Management Alongside Technical Analysis
Learn technical analysis for free with Aceink, which helps identify trading opportunities, while risk management safeguards traders emotionally and financially. The webinar is very keen on enabling novices to learn.
- Stop-loss discipline
- Position sizing
- Risk-reward concepts
- Capital protection mindset
This establishes healthier market practices.
Understand Trading Psychology from the Beginning
Emotions have a significant influence on trading decisions, particularly in new traders.
The webinar also describes:
- Fear and greed in trading
- Emotional breakout chasing
- Overtrading mistakes
- Importance of patience and discipline
This state of psychological awareness helps traders become increasingly consistent.
Why Aceink Conducts the Webinar Every Sunday
Sunday classes allow traders a chance to concentrate on the learning process without the pressures and interference of the live markets. The weekly webinar of Aceink assists participants to:
- Improve technical analysis understanding
- Review chart behavior practically
- Build stronger market confidence
- Prepare for the upcoming trading week
Such a consistent learning environment helps novice learners improve over time.
Learn from SEBI-registered stock market analyst Bharath Shankar
The best thing about the webinar offered by Aceink is the practical learning with Bharath Shankar, a SEBI-registered stock market analyst specializing in disciplined, structured stock market education.
The webinar is not about unrealistic promises or shortcuts; rather, it aims to help traders understand market behavior, technical analysis, and disciplined decision-making, with a focus on the Indian market.
Who Should Attend This Webinar?
Aceink’s webinar is ideal for:
- Novices in learning about the stock market.
- Traders who have trouble reading charts.
- People who desire simplified technical analysis education.
- Trading professionals with an interest in working.
- Traders desiring real-world market knowledge.
The webinar will simplify technical analysis and make it more accessible to novices.
Why More Traders Are Joining Aceink’s Webinar
Aceink is attracting a large number of traders to its webinars because the sessions focus on clarity and practical knowledge rather than technical jargon. Participants appreciate:
- Beginner-friendly explanations
- Simplified chart-reading concepts
- Real market examples
- Structured learning approach
- Technical analysis practice.
This makes the learning environment a lot more powerful to beginners.
Conclusion
Technical analysis is much more palatable when explanations are presented in sequence, with practical chart examples, rather than as a complex theory. The problem with most beginners is that they attempt to learn some of the more advanced strategies without a solid foundation.
The Sunday webinar by Aceink with the SEBI-registered stock market analyst Bharath Shankar will help traders learn technical analysis for free, including chart-reading training, breakout analysis, support and resistance, risk management concepts, and developing discipline in the market.
For novices seeking to develop robust technical and practical stock market knowledge and skills, Aceink offers a free webinar with a well-organized, user-friendly learning environment and no fee.