
Traditional indicators are the starting point of most traders in the stock market. They include RSI, MACD, Moving Averages, Bollinger Bands, Stochastic Oscillators, and a few other tools on their charts in their quest to identify the ultimate buy and sell signals.
At first glance, Traditional indicators appear useful because they make market analysis easier. Nevertheless, a couple of months later, most traders come to appreciate that indicators are not enough to achieve profitable trades. Signals can become faulty, false breakouts can occur, and losing trades can be experienced even when using indicator-based strategies.
This is what makes traders think that technical analysis fails. This is not the case.
It is not the issue of technical analysis. The issue is with the majority of traders applying indicators.
Learning to avoid the pitfalls of Trading Indicators can help traders focus on what really matters and make the right decisions in the market much more effectively.
Why Most Traders Depend Too Much on Indicators
Indicators are appealing to the eye because of their apparent simplicity and objectivity. Traders are seeking something simple with indicators rather than analyzing market structure, trend strength, or price action.
Many beginners ask:
- What is the best indicator to buy?
- What is the indicator of market direction?
- Which indicator has the highest accuracy?
This, unfortunately, results in traders becoming dependent and failing to learn to read real charts.
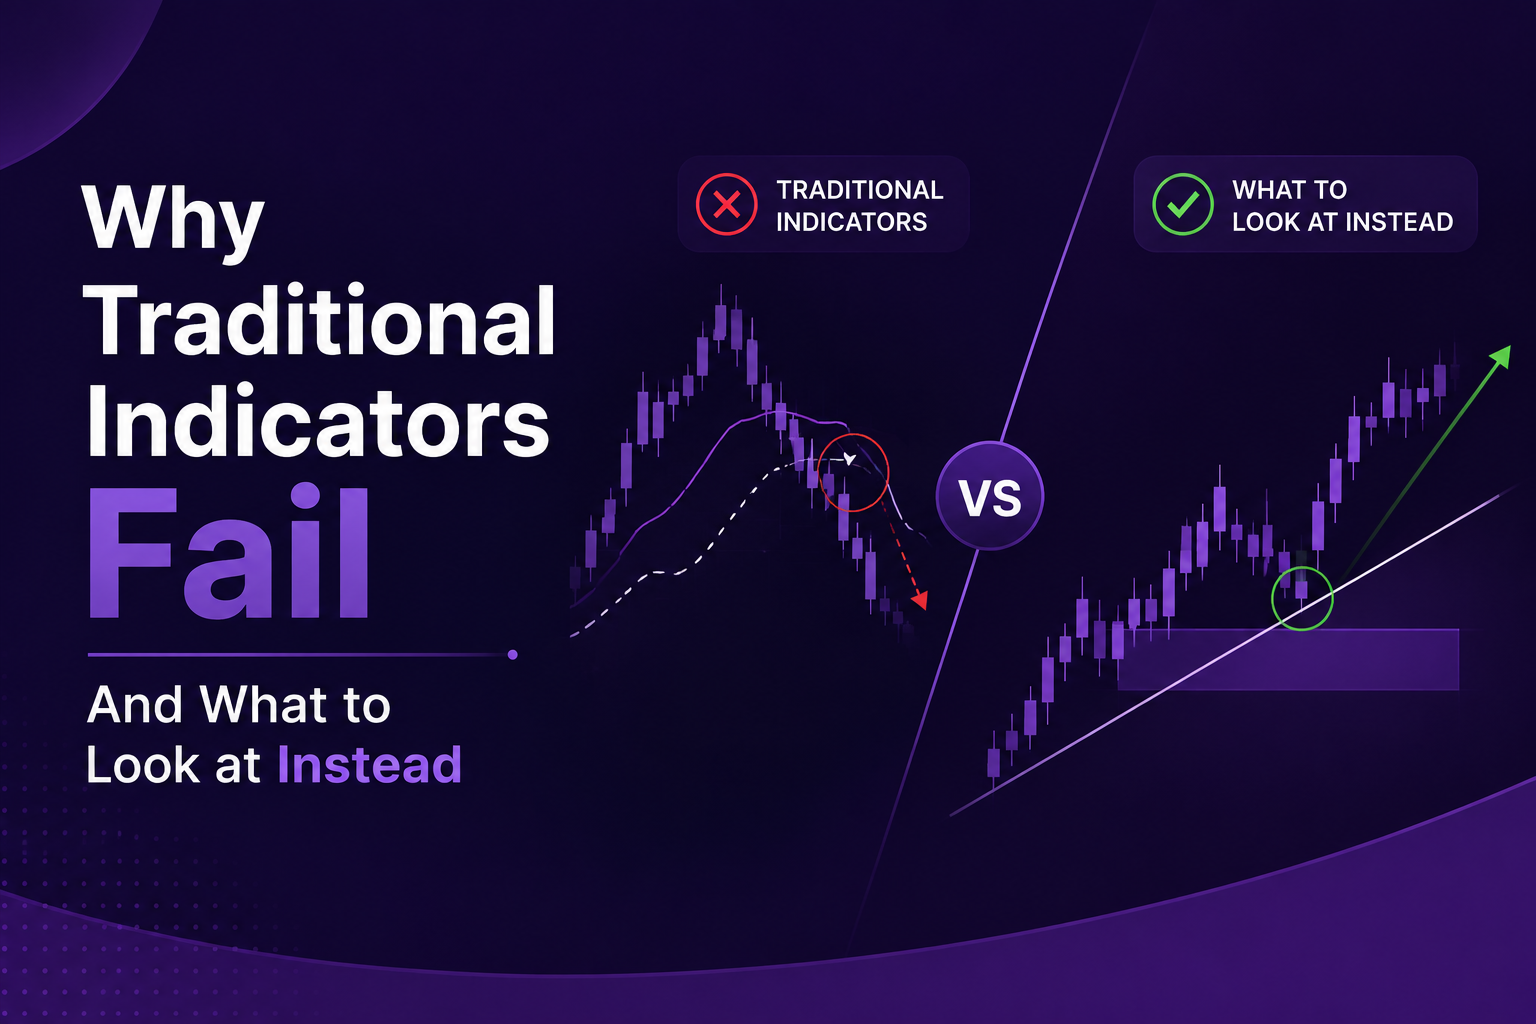
Why Traditional Trading Indicators Fail
The Traditional indicators are powerful but have their limitations. These are some limitations every trader should know.
Indicators React After the Move Has Started
The majority of conventional indicators are based on previous price history. This is because they respond to what has already occurred rather than anticipating what is to come.
An illustration of this is that a Moving Average crossover may frequently indicate that much of the movement has already occurred. By the time the signal comes up, a fair share of the opportunity might be lost.
That is one of the main reasons Trading Indicators Fail when blindly followed by traders.
Too Many False Signals
All traders have found themselves in situations where indicators provide signals that fail very quickly. Markets are always moving between trending and sideways markets.
A strong trend indicator can produce a series of false signals when in a consolidation period. This is confusing and extraneous waste.
Indicators Ignore Market Context
A buy signal does not necessarily imply a good trade. To trade successfully, one needs to know the following:
- Trend direction
- Market structure
- Support and resistance
- Volume behavior
- Risk-reward opportunities
The traditional indicators tend to lack this general market picture.
One Indicator Cannot Work in Every Market
Numerous merchants spend years finding an ideal pointer. The truth is that no indicators are effective under all market conditions. Other markets, such as trending, volatile, and sideways markets, do not behave the same way. It is not realistic to expect a single tool to work equally well in all environments.
Most Beginners Use Indicators Incorrectly
Most problems associated with traditional indicators come from improper use, not from shortcomings in the indicators themselves.
Common mistakes include:
- Using too many indicators together
- Ignoring trend direction
- Blind to all signals.
- Avoiding risk management
- Chasing trades emotionally
Such errors lower the trading performance.
What Smart Traders Focus on Instead
Professional traders do not often rely on indicators. Rather, they concentrate on market behavior.
Market Structure
Market structure is a useful source of information regarding trend direction and momentum.
Knowing higher highs, higher lows, lower highs, and lower lows allows traders to detect market strength better than an indicator can.
Trend Analysis
Strong trend analysis enables traders to trade in line with market direction and not against it. Knowledge of whether the market is:
- Trending higher
- Trending lower
- Moving sideways
helps the selection of trade to a large extent.
Price Action
The price action shows what the buyers and sellers are really doing. Rather than relying on indicator signals, seasoned traders are able to see:
This gives more insight into the market.
Volume Confirmation
Volume helps traders understand the movement behind it. Strong volume, backed by a breakout, can be more important than a breakout on weak participation. This extra assurance enhances the quality of the decision.
Risk Management
The analysis itself can even fail, even the best one. This is why professional traders are more concerned with risk management than with prediction. Effective risk management helps safeguard capital and enhance trading stability over the long term.
How Aceink Trading Indicator Simplifies Market Analysis
After identifying shortcomings in conventional indicators, Aceink developed the Aceink Trading Indicator to make traders’ analysis much easier. Rather than adding unnecessary complexity for traders, the indicator aims to enhance market visibility and support structured decision-making.
Built for Better Market Clarity
Determining the market’s direction with certainty has been one of the greatest challenges traders face. The Aceink Trading Indicator can assist in streamlining trend interpretation and understanding the market.
Helps Identify Market Direction Faster
To be a successful trader, it is important to understand whether the market is bullish, bearish, or in the process of consolidation. The indicator will assist traders in identifying the dynamic market conditions more effectively.
Simplifies Trend Analysis
One of the crucial elements of technical analysis is trend analysis. The Aceink Trading Indicator assists traders who need to focus on trend-driven opportunities and avoid letting short-term noise distract them.
Helps Traders Focus on High-Probability Setups
The indicator does not create a need to engage in excessive trading; rather, it helps traders identify clearer opportunities and avoid unnecessary market participation.
Designed for Practical Market Conditions
Markets are dynamic and ever-changing. The Aceink Trading Indicator is grounded in practical market use, enabling traders to enhance their trading experience and overall market understanding.
Learn How the Aceink Trading Indicator Works
The Aceink Trading Indicator is best understood through practical examples and real-world market scenarios.
Aceink offers a Free Stock Market Webinar every Sunday during which traders get to learn the following:
- How the Aceink Trading Indicator works
- How to detect trends more productively.
- How to improve chart analysis
- How to combine technical analysis with market structure
- How to improve trading discipline and decision-making
The webinar is based on SEBI-registered Research Analyst Bharath Shankar and is aimed at both novice and mature market participants.
Conclusion
Traditional indicators are not magic solutions and can still be helpful tools. In the majority of cases where Traditional Indicators Fail, traders rely solely on them and pay no attention to market structure, market trends, price action, or risk management.
The most effective traders employ indicators as part of a broader decision-making process rather than viewing them as trading systems.
The Aceink Trading Indicator was created to make the market easier to analyze, bring out clarity, and allow traders to concentrate on relevant opportunities rather than wasteful noise. With appropriate technical analysis and disciplined implementation, it may become a useful tool in a trader’s arsenal.
To understand the Aceink Trading Indicator, technical analysis, trading psychology, risk management, and professional market structures, enroll in the Free Stock Market Webinar organized by SEBI-registered Research Analyst Bharath Shankar every Sunday at Aceink.