Most beginners start learning technical analysis enthusiastically, only to be overwhelmed very soon. They see complicated indicators, confusing chart setups, and endless trading strategies online. Several dozen videos later, many traders still cannot find the right answer to a simple question: how to read a stock chart properly.
This is because most individuals learn technical analysis on paper but never know how the charts will behave in the actual market.
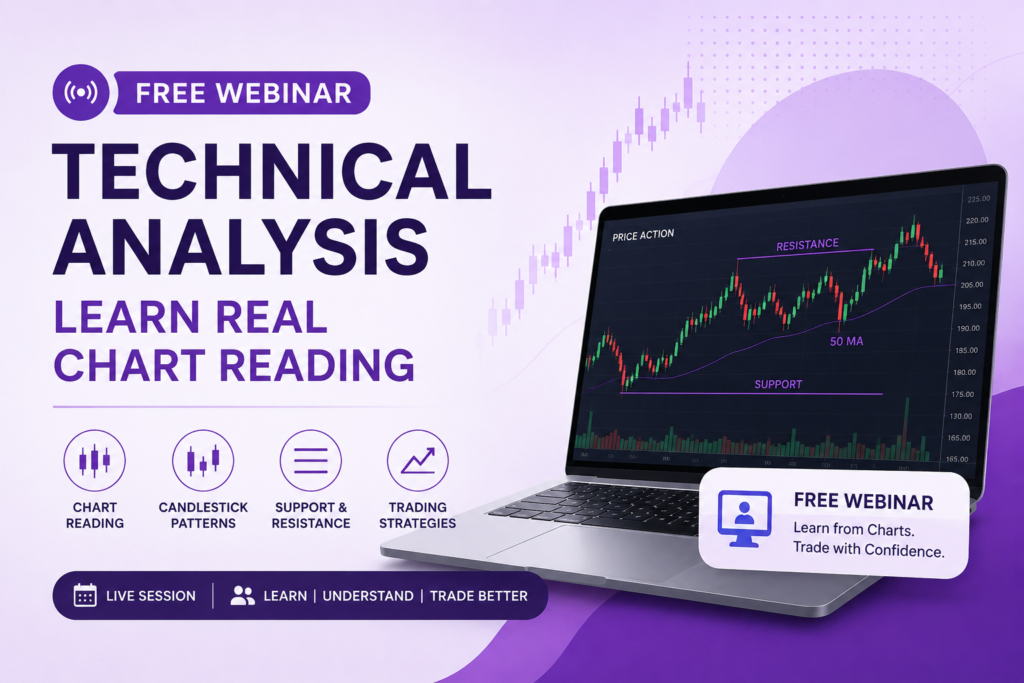
That is precisely the reason Aceink is offering a free, chart-reading, practical technical analysis webinar every Sunday to help traders learn to read charts in a simplified, beginner-friendly manner.
The Stock Market webinar is conducted by the SEBI-registered stock market analyst, Bharath Shankar, wherein the main tasks are practical stock market knowledge, the learning of technical analysis, and the learning of disciplined chart-reading.
Why Most Beginners Struggle with Technical Analysis
Technical analysis is not hard in itself. The actual issue is the learning methodology. Many beginners:
- Acquire too many signals in one place
- Aim at shortcuts rather than foundations
- Learn possible patterns without being familiar with price behavior
- Watch random trading videos every day
- Disregard market structure altogether
This is rather confusing than clear.
These concepts are made step-by-step easy to understand with a structured technical analysis free webinar that enables the beginner to actually learn how charts work.
What is Technical Analysis?
Technical analysis refers to the study of charts, price movement, market trends and market behavior with the aim of comprehending the trading opportunities.
Technical analysis aids traders in analyzing rather than just relying on news or opinion:
- Price action
- Market trends
- Support and resistance areas.
- Momentum behavior
- Breakout structures
This enhances the quality of decision-making and understanding the market.
Why Real Chart Reading Matters in Trading?
A lot of traders will be familiar with indicators names but will not be able to analyze a live chart. Learning the actual chart reading is significant due to the ability to grasp the following by traders:
In areas where customers are dynamic.
- Where there are sellers
- What is the powerful trend?
- What arrangements are feeble?
- The dynamics of the change of momentum
The absence of chart-reading skills will make the trading decision-making emotional and desperate.
What You Learn in Aceink’s Technical Analysis Free Webinar
The webinar created by Aceink aims to make beginners comprehend technical analysis in a realistic manner, rather than confusing them with the inappropriate amount of complexity.
Learn How to Read Market Trends Clearly
The most important component of technical analysis is trend understanding. The webinar assists traders in understanding:
- Uptrend structure
- Downtrend behavior
- Sideways market movement
- Trend continuation concepts
This forms a more solid market base.
Understand Support and Resistance Properly
One of the most influential concepts in chart reading is support and resistance. A free webinar on technical analysis offered by Aceink discusses how traders with such zones can:
- Identify entry opportunities
- Improve stop-loss placement
- Understand breakout levels
- Analyze market structure
This practical knowledge enhances confidence in charts to a high level.
Learn Candlestick Reading in a Simplified Way
Candlestick discloses key market dynamics. The webinar educates traders on the ways to comprehend:
- Rejection candles
- Momentum candles
- Breakout candles
- Market indecision patterns
Traders are taught the importance of candlesticks that indicate the activity of buyers and sellers rather than know patterns by heart.
Breakout and Pullback Chart Analysis
“Breakout” and “pullback” are terms that are regularly talked about by many traders but they are often not able to recognize them on live charts. Aceink’s webinar explains:
- What strong breakouts look like
- How fake breakouts happen
- How pullback entries improve timing
- How trend continuation setups work
This is a practical method to make traders examine charts more assuringly.
Why Practical Learning is Important in Technical Analysis
Most amateurs lose out as they acquire the technical information at the theoretical level without experiencing how the concepts work in the real market situation.
The structured free webinar on technical analysis, which consists of practical chart use, assists traders in substituting theory with real-market behaviour. This simplifies learning and makes it more beneficial.
Learn Risk Management Alongside Chart Reading
Consistency does not just come as a result of technical analysis. Trading discipline involves a significant component of risk management.
The webinar by aceink will assist traders to know:
- Stop-loss discipline
- Risk-reward concepts
- Position sizing
- Capital protection mindset
This initiates healthier practices in trading.
Trading Psychology and Technical Analysis Connection
Trading is closely linked with charts and emotions. The webinar also describes the influence of emotional behavior in making technical analysis decisions like:
- Fear during pullbacks
- During momentum moves, greed
- Emotional breakout chasing
- When it comes to losing, revenge trading
Learn from SEBI-registered stock market analyst Bharath Shankar
Among the greatest strengths of the Aceink webinar is the learning session with Bharath Shankar, who is a SEBI-registered stock market analyst with a passion to offer practical and disciplined education on the stock market.
Rather than false trading promises, the webinar is aimed at guiding traders to comprehend the real market dynamics, the notion of technical analysis and disciplined trading strategies, all to suit the Indian market environment.
Conclusion
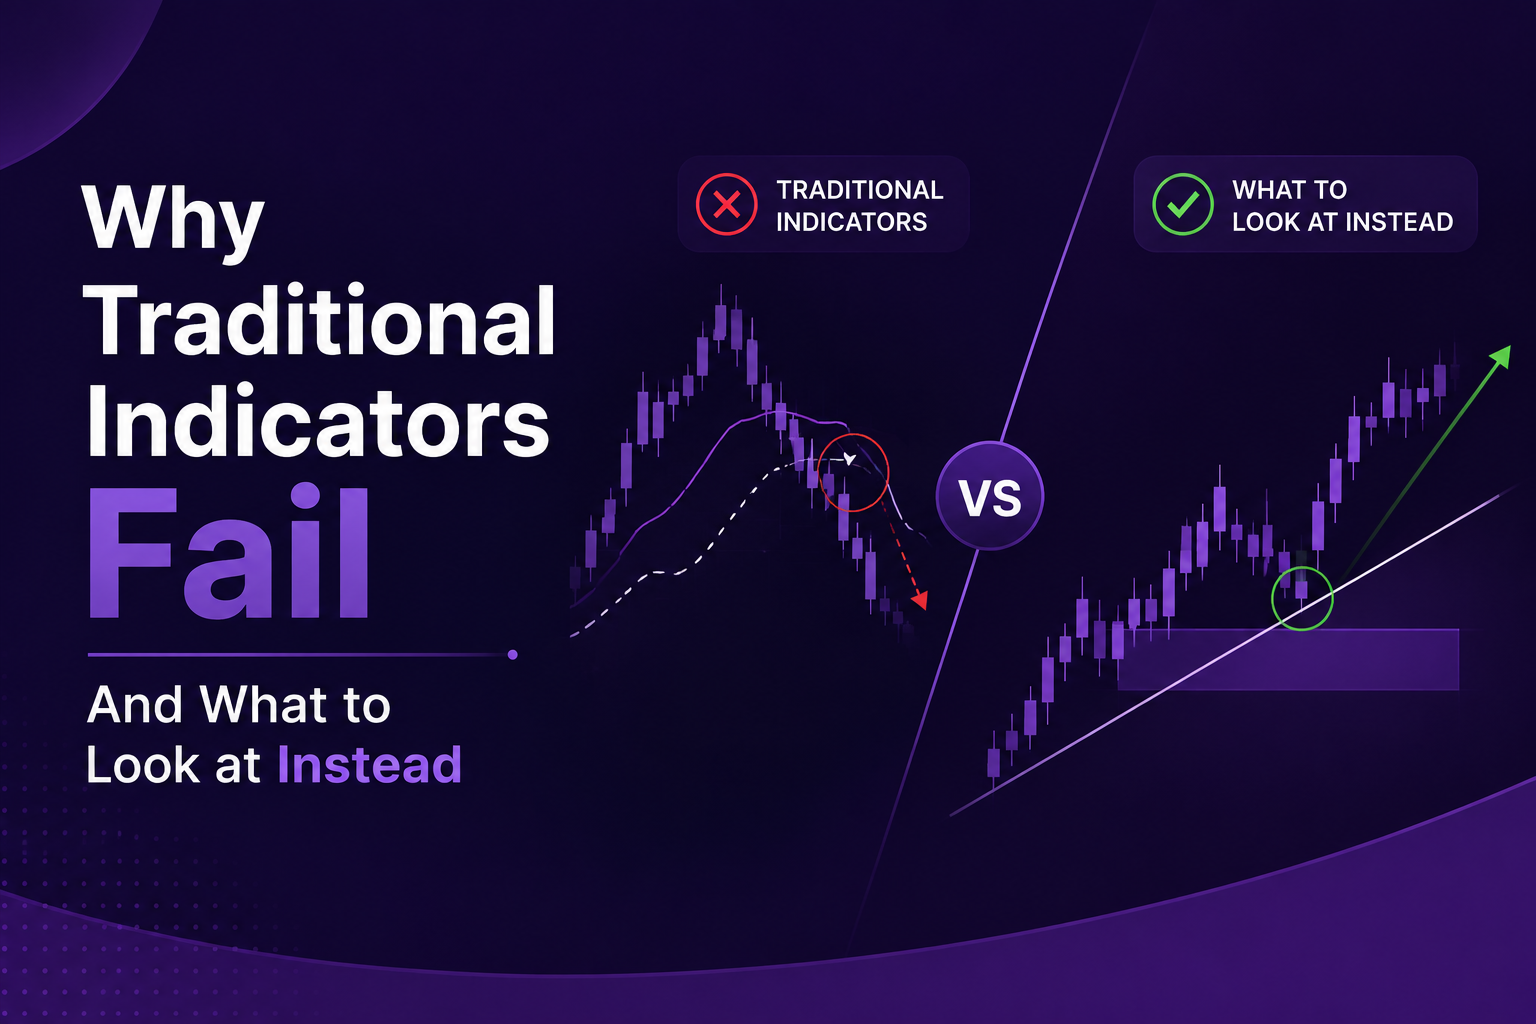
Technical analysis is significantly simplified when taught in a practical manner, using real examples of chart reading rather than theory. This is a common pitfall, as most beginners attempt to learn indicators without first learning market structure and price behavior.
In his Sunday technical analysis free webinar, Aceink, a manual of SEBI Registered Stock Market Analyst, Bharath Shankar, educates traders to learn how to read charts, perform breakout analysis, and understand concepts of support-resistance, risk management and disciplined trading behavior through learning in practical markets.
For beginners seeking greater confidence in chart reading and a working knowledge of the stock market, Aceink’s free webinar offers a well-organized, beginner-friendly online study experience with no initial registration fee.