
How to Find High Probability Trades?

Most traders put too much effort into hunting for the next big stock pick and almost none into checking one basic question. Does this setup actually look solid? That mistake is the root of many trading problems. Random entries, trades driven by feelings, and extra losses usually occur when people chase action instead of real odds. The stock market pays off for quality more than for how many trades you make. Someone who takes just two solid setups can end up doing much better than a trader who jumps into ten weak ones. This is exactly why learning to spot high probability trades stands out as a key skill for anyone in the markets. A high probability trade does not promise success every time. It means you have lined up several good reasons so the trade gains better form, sharper entry timing, and tighter control over the risk involved. What is a High Probability Trade? A high probability trade is a setup in which a number of key elements come together and raise the chances of a positive result. This never guarantees the trade will succeed. Every trade carries uncertainty. Still, when several signs back up the same idea, the chances get noticeably better. Take a stock that stays in a clear uptrend, pulls back to a support area, shows positive price behavior, and matches rising volume. That combination builds a much stronger case than jumping in after seeing just one clue. Traders should keep their attention on raising the overall quality of every trade they consider. Why High Probability Trades Matter Trading comes down to working with probabilities instead of trying to predict the future. The aim is not winning all your trades. The real target is choosing trades where the balance of odds sits on your side across many attempts. High probability setups bring more consistent results for traders since they cut down on guesswork and strengthen self-control. They also build greater confidence because the whole process for deciding gets clearer and follows a logical order. Key Factors That Create High Probability Trades A solid setup almost never rests on a single clue. High probability trades grow from several elements working together. Trend Alignment Trend acts as one of the best filters available to traders. When you take positions that follow the main trend, you move with the market’s primary direction. This step raises your chances on its own. Buying chances look better inside an uptrend. Selling chances look cleaner inside a downtrend. Going against the trend usually adds extra trouble that you can avoid. Support and Resistance Zones Clear support and resistance areas give real structure to price movements. These spots mark places where price turned in the past and where buyers or sellers tend to show up again. A trade placed close to these zones offers improved timing and easier decisions on where to place stops compared with entries made at random spots. Price Action Confirmation Price action reveals whether the market is truly reacting at your chosen area. Examples like bullish engulfing patterns, strong rejection wicks, or powerful breakout candles often point to real intent from buyers or sellers. A level alone stays just a level until price shows clear reaction. That reaction brings added power to the entire setup. Volume Participation Volume reveals how much force stands behind any price shift. A breakout backed by heavy volume or a reversal with visible buyer or seller activity tends to hold higher odds because it reflects real market commitment. Moves that happen on thin volume tend to break down more often. Risk-Reward Ratio Any worthwhile trade setup also needs to pass a basic risk test. When the possible gain looks too small next to the risk you take, the setup may not justify entry even if other parts look good. Professional traders always check this ratio before they commit to a position. Step-by-Step Process to Find High Probability Trades Following an organized method cuts emotional choices and supports more consistent performance. Identify the Overall Market Trend Begin every analysis by looking at the larger market direction first. Check whether the stock moves mainly higher, lower, or stays flat without clear direction. This step sets your main bias for the trade. Mark Important Levels Locate the major support and resistance zones on the chart. These levels point out the spots where real trading chances may appear. Wait for Price to Reach the Zone Waiting matters a lot in this work. Avoid running after price. Give the market time to reach the area you have already marked. Look for Confirmation After price arrives at your level, watch its behavior closely. Search for definite signs of strength or clear rejection before you decide to enter. Plan Your Risk Before you open any position, set these points clearly: This approach keeps the trade organized and under control from the start. Real Example of a High Probability Trade Picture a stock that holds a steady uptrend and keeps printing higher highs along with higher lows. Price comes back to a key support level that also sits near the 20 EMA. Right at that support, a bullish engulfing candle appears together with higher than normal volume. The setup now carries several supporting clues: This counts as a high probability trade since multiple pieces line up at the same time. Common Mistakes Traders Make Traders often lower their own success odds by making simple but repeated errors. Taking Trades Without Structure Jumping in without first checking trend and support levels leads to setups that lack real strength. Ignoring Confirmation Entering positions too soon before price shows any reaction at the level raises the chance the trade will fail. Chasing Extended Moves Buying right after a big upward run or selling right after a sharp drop usually results in weak entry points. Overtrading Opening too many average trades spreads attention thin and creates more pressure from emotions. How to Improve Trade Selection Raising the quality of trades you take often works better than
Breakout Strategy Explained (With Real Trades)
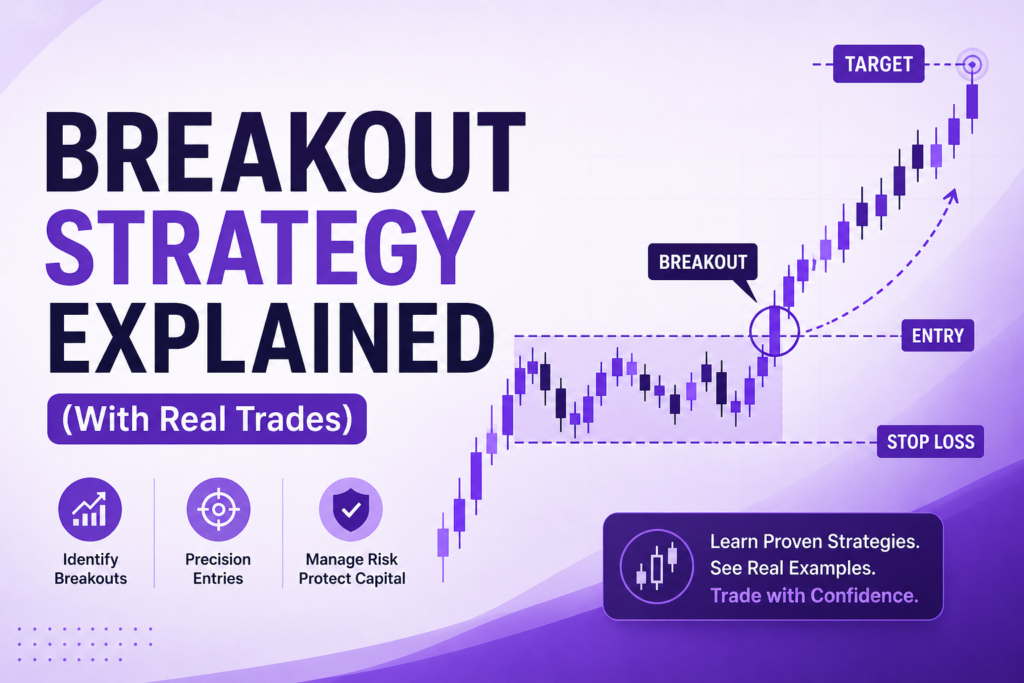
One of the most popular trading styles in the stock market is breakout trading, which emphasizes momentum and expansion. Price moving strongly across a significant level is likely to generate great opportunities for traders who know how to find it and execute it correctly. However, the challenge here is that not all breakouts are successful. Novices jump in too soon, get caught in fakeouts, and become discouraged by the approach. Rarely is the issue the breakout itself. The timing, confirmation, and understanding of the problem are normally the issue. This guide simplifies the understanding of breakout trading in a way that you can comprehend how actual breakout setups are as well as how disciplined traders go about them. What does it mean by Breakout Trading Strategy? A breakout plan focuses on identifying price movement beyond a significant support or resistance point and trading the ongoing move. Simply, a price breaking an important level it was previously confined to generally signals a shift in momentum, and a larger movement might occur. Breakouts usually occur after consolidation, as the market accumulates pressure within a range. After the release of such pressure, a price usually moves very sharply in either direction. Why Breakout Trading Works Breakout trading is effective because markets fluctuate in their stages of contraction and growth. During consolidation, buyers and sellers are equalized. Price is within a narrow range. Under mounting pressure, one party ends up controlling the situation, leading to a breakout. This change develops momentum. The advantage of breakout strategies is that they enable traders to take new moves and avoid late entries into already stretched trends. Types of Breakout Setups In various market structures, breakouts may occur. The knowledge of such arrangements enhances the quality of decisions. Resistance Breakout This occurs when the price goes above a strong resistance area. It shows that buyers have already taken up the pressure to sell and the pressure could be further pushing the price higher. This is among the widely used bullish breakout arrangements. Range Breakout When a price operates within a narrow band and then explodes out of it, it can build considerable momentum, as there has been mounting pressure. In short-term and swing trading, range breakouts are very popular. What is Support Breakdown (Seller Side)? A support breakout occurs when the price moves below and sustains the support zone. There has been an increase in selling pressure and sellers have taken over the market. As weakness continues, such setups often create new downside opportunities. When markets are weak, support breakdown provide bearish trading opportunities. Step-by-Step Process to Identify Breakouts Emotional and random entries are prevented through a structured process. Identify Strong Support or Resistance Marking significant price levels that have been responded to multiple times is the initial step. The higher the level, the better the potential for a breakout. Watch for Consolidation Near the Level It is a good reform when prices converge around a point since it means that the pressure is mounting. Narrow-range trading results in frequent breakouts. Wait for Breakout Confirmation Breakout is not proven when the price touches or goes beyond the level. Confirmation occurs when the price extends above the level and remains above it. A lot of novices fail here. Observe Volume Participation Volume contributes to breakout analysis. The breakout with good participation is usually more stable than the breakout with poor activity. Plan Entry, Stop-Loss, and Target Always define before entering: This maintains the trade organized. Real Trade Example: Resistance Breakout Well, to give a practical example. Suppose a share that is trading between ₹480 and ₹500 in three weeks. Price attempts to test ₹500 several times without any success. This is pressure-testing. After some time, the price breaks above ₹500 with a strong candle and ends at 510. Price retests ₹500, and the following day, the price holds. This retest substantiates the breakout. A trader coming in after confirmation has the following: This is the discipline of breakout traders that approach the market. Real Trade Example: Range Breakout Consider a stock trades at ₹950-980 over several sessions. Price will stay within this range as volatility diminishes. Finally, the price breaks above 980 and has a good momentum and maintains above. This breakout means that the consolidation stage is over and growth has begun. Traders usually get in once it is confirmed, then refer to the previous range to set a stop-loss. Common Mistakes in Breakout Trading Breakout trading is easy to use, but it is easy to make simple mistakes that can reduce the consistency. Entering Too Early Before the breakout is established, many traders get in. This leads to higher occurrence of fakeouts. Ignoring Market Trend The breakouts against the general trend are less likely. The alignment of trends enhances quality. Trading Weak Levels Not every level is significant. The lowly tested levels tend to give weak breakouts. No Risk Management Even powerful breakouts are not always successful. Losses that do not have stop-loss are hard to manage. How to Avoid Fakeouts in Breakout Trading Trading includes fakeouts and can be minimized. Such rudimentary filters enhance the quality of trade. Why Breakout Trading is Important in Stock Market Learning Breakout trading trains traders on how to spot expansions of momentum, the behavior of prices as well as how to sell better. It assists traders to build patience since the finest breakout trades can be a process of waiting to get the appropriate setup and confirmation. This renders it a powerful section of feasible Stock Market Education. Why Choose Aceink for a Free Stock Market Workshop and Become Expert? Aceink is the best Stock recommendation company, headed by SEBI-registered stock market analyst Bharath Shankar, that assists traders in understanding breakout strategies, market structure, and the disciplined performance of the trade through structured stock market education and practical learning. Learn Practical Breakout Strategies Learn how actual breakout configurations develop and how to pick quality trades at a more opportune time. Build Better Trade Discipline Understand how patience and confirmation
Pullback Trading Strategy for Consistent Profits
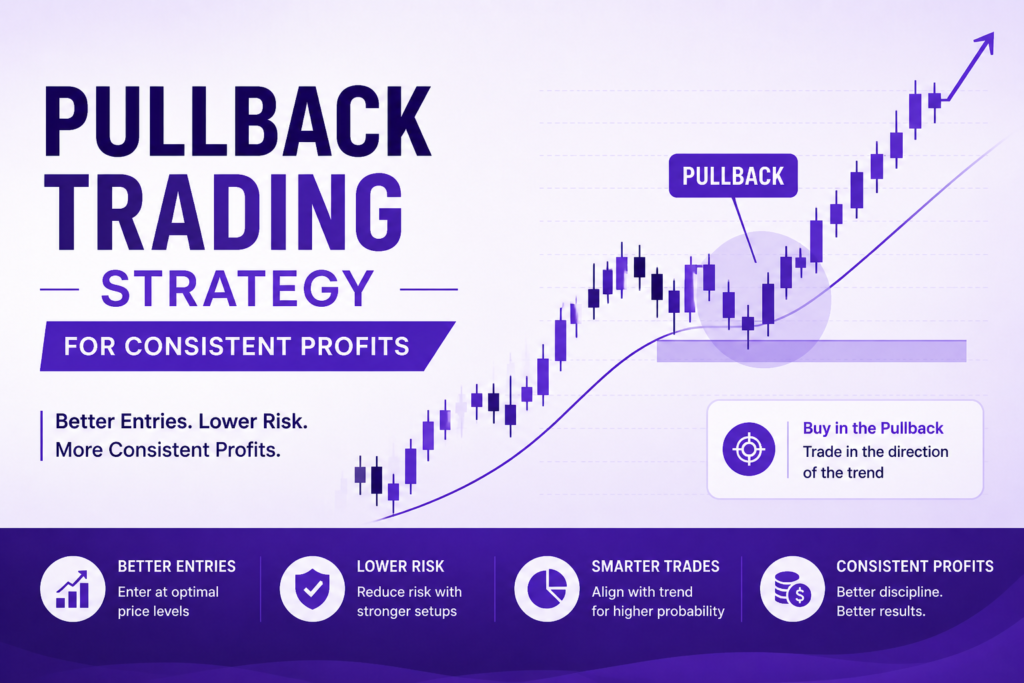
Many traders make one common trading mistake: they chase prices after a big move. Once a stock is already on a roll, they jump in and get excited, only to see it pull straight back. This usually results in poor entries and unwarranted losses. This is where pullback trading comes into play. Rather than following momentum, pullback trading teaches you to wait until price breaks back, providing a superior entry into the prevailing trend. It is among the most feasible tactics employed by disciplined traders, as it enhances entry quality and risk management. When used correctly, pullback trading can help traders build a pattern of consistency by trading slowly rather than hastily. What is the Pullback Trading Strategy? Pullback trading is the art of waiting to trade during a short-term backlash in the trend to exploit the trade. A pullback is not a backward step. It is nothing but a momentary action opposite to the direction before the trend moves in the same direction. To illustrate, during an uptrend, a price increases, then makes a temporary decrease and proceeds to increase. That short-lived downturn is the pullback. This strategy is quite simple in nature which is to enter at improved prices rather than play prolonged moves. Why Pullback Trading Works Markets do not progress in a linear manner. Price movements in a strong trend go through periods of momentum and correction. Pullbacks occur due to traders taking profits, short-term sellers trading or the market taking a break. However, a continuation by the trend will make buyers tend to revisit and continue with the trend. This creates opportunity. Pullback trading is effective as it enables traders to: This renders it one of the most powerful ideas in feasible trading. How to Identify a Pullback A pullback ought to be discerned in a clear trend. In the absence of trend, there is no pull back strategy. These are what to look out: Strong Existing Trend Temporary Retracement The pullback must not be aggressive. When price falls too far, it might be indicating that it is weak instead of a healthy pullback. Important levels are typically honored by healthy pullbacks. Reaction at Important Levels Good pullbacks frequently occur around: These stages enhance the chances of carrying on. Types of Pullback Trading Setups The pullbacks may have various forms depending on the market structure. Support-Based Pullback During an uptrend, the price tends to be drawn back to the earlier support and then continues to move upwards. This is among the most sure pullback systems since support is a demand area. Moving Average Pullback Several traders apply moving averages such as 20 EMA or 50 EMA as dynamic support in the pullbacks. In case of a revival in price, which moves towards these averages and is strong, continuation becomes probable. Trendline Pullback Trendlines are usually honored in trending markets. High-probability can be formed by a reversal to the trendline and a vigorous bounce. Step-by-Step Process to Trade Pullbacks A systematic procedure enhances uniformity and elimination of emotional decision-making. Identify the Trend First Always begin with the pullback. Begin with the direction of trends. Lack of a powerful trend leaves the pullback at a disadvantage. Mark Key Support Zones Locate price responsive areas. These may be the past support, moving averages or trendlines. Wait for Price to Retrace Patience is critical. Never enter when price continues to move aggressively. Wait to be retruded to your zone. Look for Confirmation This can be proved by: This is an assurance that consumers are coming back. Plan Entry and Risk Before entering: This creates structure. Common Mistakes in Pullback Trading Pullback trading is not as easy as it may seem. Confusing Pullback with Reversal A pullback is not necessarily a retracement. In some cases, it marks the turnaround of the trends. This is the reason why confirmation is important. Entering Too Early Many traders do so during the fall itself rather than stabilizing the price. This increases risk. Ignoring Trend Strength When trends are weak, pullbacks are weak. Concentrate on robust and sound market structure. No Risk Management Even good pullback configurations do not work. Risk control has been critical. How to Improve Pullback Trading Accuracy To better this plan, it needs monitoring and punishment. Process and not speed bring about consistency. Why Pullback Trading is Important in Stock Market Learning Pullback trading educates patience, timing and well-organized entry. It can aid traders to realize that they can make better entries through waiting rather than pursuing. This renders it a significant component of Stock Market Learning, in particular, to novices who find it difficult to be emotionally in the market. Why Choose Aceink for Free Stock Market Workshop and Become Expert? Aceink is the leading Stock recommendation company and is the brainchild of SEBI Registered Stock market Analyst Bharath Shankar, who assists traders to gain practical understanding of the market by means of structured learning, live market training given as well as strategy-based recommendations, which aims at enhancing decision-making and trading discipline. Learn Practical Pullback Strategies Know how pullbacks can be constructed in actual market environments and how to recognize better timing quality setups. Build Strong Market Understanding Master the trend structure, price action, and support areas in a simplified and practical manner. Avoid Common Trading Mistakes Aceink is concerned with assisting traders in reducing emotional decision-making and improving execution discipline. Learn from SEBI Registered Stock Market Analyst Learn directly from Bharath Shankar and see how disciplined traders approach the market. Learning Opportunity Free Stock Market Learning Aceink Free Stock Market Webinar assists traders in building solid foundations and learning to trade in real markets. Conclusion One of the most viable strategies is pullback trading, which trains patience and requires higher entry timing. Rather than pursuing price, it assists the traders to wait until they have chances where the risk is contained and the likelihood is high. Aceink assists traders to learn this strategy in its Free Stock Market Webinar, where pullback trading, market structure, and implementing the
3 Proven Trading Strategies That Actually Work
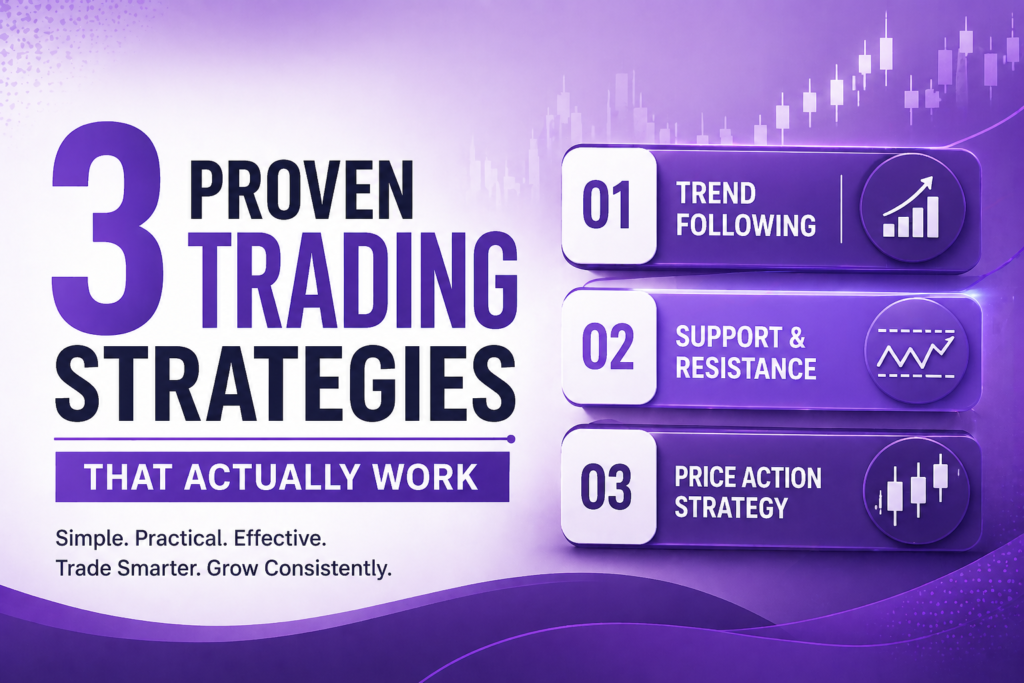
Most traders lose money not because they have no strategies. They lose because they jump from one approach to another without first learning how the market structure really functions. One week, they chase breakouts. Next week, they switch to indicators. Then they follow whatever tip comes along. All this switching only creates more confusion instead of building any real consistency. The truth stays straightforward. Trading does not require complex systems at all. It needs a solid framework that holds up in various market conditions. The correct strategy lets you spot good chances, control your risk, and follow through with clear discipline. In this guide, we will go through three proven trading strategies that actually deliver results and are commonly used by committed traders. 3 Proven Trading Strategies That Actually Work Every solid trading strategy rests on one basic idea: understanding how price behaves. These three strategies stay reliable because they rely on market structure, momentum, and realistic probability. Learn how to identify market trends like uptrend, downtrend, and sideways using simple price action techniques to improve your trading decisions. 1. Trend Following Strategy Trend following ranks among the most useful trading strategies because it aligns your trades with the market’s current direction. Rather than trying to guess when the market will turn, this method sticks with the momentum that is already present. During an uptrend, traders watch for chances to buy on pullbacks. In a downtrend, they look for chances to sell on rallies. This method raises your odds of success because the market is already heading your way. The real power of this strategy comes from patience. Waiting for the proper pullback usually gives cleaner entries than rushing after price. 2. Breakout Trading Strategy Breakout trading centers on price pushing through key support or resistance areas with clear force. These zones often work as barriers. When price moves past them with real momentum, fresh opportunities tend to appear. A solid breakout setup often follows a period of consolidation. This shows that pressure has been building in the market. After price clears the level and holds above or below it, traders watch for the move to continue. Confirmation matters most here. Jumping in too soon frequently results in fakeouts. 3. Support and Resistance Reversal Strategy This strategy pays attention to how price reacts when it hits major support and resistance zones. Instead of trading with the continuation, traders hunt for reversal chances where price displays clear rejection or signs of weakness. For example, if price arrives at strong support and shows bullish rejection, it can signal a buying chance. In the same way, rejection at resistance can point to a selling chance. This approach succeeds because support and resistance levels are places where supply and demand come into play strongly. How to Choose the Right Trading Strategy Picking the right strategy has nothing to do with what everyone else is talking about. It depends on what fits your personal trading style and your grasp of the market. The aim is never to learn every possible method. The aim is to master the one that matches you. Learn the most common trading mistakes beginners make, including overtrading, emotional decisions, and poor risk management, and how to avoid them for better results. Common Mistakes Traders Make While Using Strategies Having a strategy is only the start. Applying it properly makes the real difference. Most traders repeat simple mistakes that hurt their consistency. These errors can undermine even the best strategy. How to Make Any Trading Strategy Work A strategy only produces results when you pair it with discipline and clear rules. Keep these main principles in mind: The gap between profitable traders and those who struggle usually comes down to how well they execute. Why Choose Aceink for Free Stock Market Workshop and Become Expert? Aceink is a leading stock recommendation company headed by SEBI Registered Stock Market Analyst Bharath Shankar. It focuses on helping traders develop real market understanding through organized learning, live market observations, and education based on practical strategies for beginners as well as traders who want to grow. Learn Practical Trading Strategies Aceink teaches strategies that perform in actual market conditions rather than just theoretical ideas that end up confusing people. Understand Market Structure Clearly Traders learn how price actually moves, the way trends develop, and how to recognize high-quality opportunities with greater confidence. Build Strong Trading Discipline The workshop shows traders why patience, clear structure, and proper risk management matter so much in trading. Learn from SEBI Registered Stock Market Analyst Participants receive hands-on guidance from Bharath Shankar, who stresses real market knowledge and organized decision-making. Free Stock Market Learning Opportunity Aceink’s Free Stock Market Webinar gives beginners a clear view of market behavior, strategies, and trading discipline without making it overly complicated. Conclusion Trading success does not come from learning lots of different strategies. It comes from understanding one strategy thoroughly and carrying it out with strong discipline. Trend following, breakout trading, and support-resistance reversal strategies continue to work because they are based on actual market behavior. Aceink supports traders in developing this understanding through its Free Stock Market Webinar. There, practical market lessons, strategy execution, and trading discipline get explained in an organized manner. If you are serious about learning the stock market, building your base with proper guidance can change everything.
MACD Indicator: Complete Guide
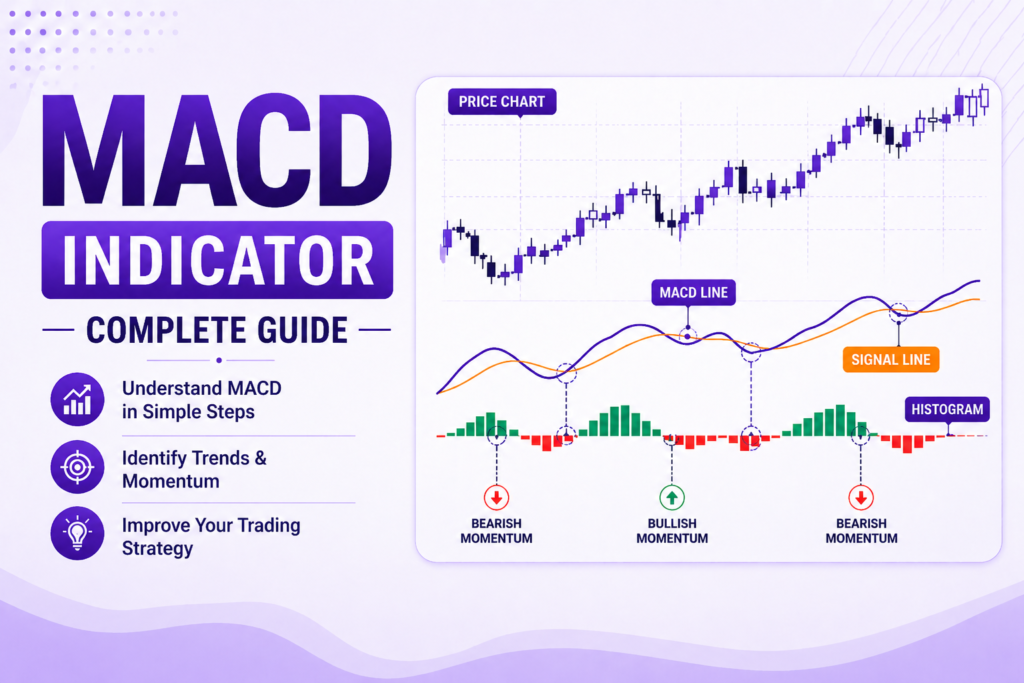
Technical tools give traders an easier way to read price moves and spot market strength. From the many available indicators, the MACD (Moving Average Convergence Divergence) stands out as one of the most favoured. It is a trend-following momentum indicator that combines the direction of the trend and its strength into one indicator. New traders often find MACD confusing in the beginning since it comes with several lines plus a histogram. Once you get how it functions, though, it turns into a useful way to catch changes in momentum, ongoing trends, and signs that a move might turn around. The main point is to grasp exactly what the MACD shows you instead of following it without thinking. This guide lays everything out clearly step by step. What is MACD? The acronym for MACD is Moving Average Convergence Divergence. It’s a trend-following momentum indicator that measures the relationship between two moving averages of price. The usual MACD setup has three parts: These pieces connect to give traders a picture of momentum and which way the trend is heading. While tools like RSI look at whether prices have gone too far up or down, MACD pays more attention to shifts in momentum and how strong a trend feels. Understanding the Components of MACD You should get familiar with how MACD is built before you start using it for trades. MACD Line The MACD line is formed when traders subtract the 26-period Exponential Moving Average (EMA) from the 12-period Exponential Moving Average (EMA). The line catches short-term shifts in momentum and is often the first to emit a warning that a trend might be changing. Stronger momentum pushes the MACD line farther from the zero line. Weaker momentum pulls it back toward the zero line. Signal Line The signal line comes from a 9-period EMA applied to the MACD line itself. It smooths the MACD line and generates clear crossover points. Traders use this line as a guide when deciding when to enter or leave a position. Histogram The histogram simply measures the gap between the MACD line and the signal line. It gives a quick visual read on how strong momentum has become. When the bars grow taller, momentum is picking up speed. When the bars get smaller, momentum is losing power. How MACD Works MACD tracks the gap that opens up between short-term momentum and longer-term momentum. If short-term momentum starts growing faster than the longer-term side, the MACD points to bullish power. If short-term momentum starts fading compared with the longer view, the MACD points to bearish pressure. Because of this, MACD does a good job spotting both the direction of a trend and any changes in its energy. MACD Crossover Strategy The crossover stands out as one of the simplest and most used MACD approaches. Bullish Crossover A bullish crossover takes place when the MACD line moves above the signal line. It shows that short-term momentum is getting stronger and buyers could be taking charge. Traders often treat this as an early sign to buy, particularly when the bigger trend lines up in the same direction. Bearish Crossover A bearish crossover occurs when the MACD line drops below the signal line. This points to fading momentum and rising pressure from sellers. Many use it as a cue to close long trades or start looking for chances to sell short. Zero Line Concept in MACD The zero line plays a key role when reading MACD. MACD staying above zero signals bullish conditions because short-term momentum beats the longer-term pace. MACD staying below zero signals bearish conditions because short-term momentum falls behind. The zero line lets traders see the larger trend picture instead of getting stuck only on the crossovers. MACD Histogram Strategy Beginners sometimes overlook the histogram, yet it offers useful early hints. Growing histogram bars show momentum gaining ground. Shrinking bars show momentum starting to fade. These changes can warn you before any actual crossover appears. For example: This feature makes the histogram handy for deciding exact timing. MACD Divergence Strategy Divergence counts as one of the most powerful ideas within MACD. Bullish Divergence Bullish divergence appears when price forms a lower low while MACD forms a higher low. It tells you that downward pressure is easing off and a turnaround could be near. Bearish Divergence Bearish divergence shows up when price forms a higher high while MACD forms a lower high. It suggests that upward pressure is running out of steam and price might start heading lower. Always wait for price action to confirm any divergence before you enter a trade. Best Way to Use MACD in Trading MACD delivers better results when you pair it with the overall market layout. A solid method looks like this: Putting these pieces together raises the quality of your trade ideas. Common Mistakes While Using MACD Plenty of traders get MACD wrong because they lean on it by itself. Typical errors include: MACD gives the best help when it backs up your overall analysis rather than standing in for it. When MACD Works Best MACD shines brightest inside clear trending markets where momentum changes stand out. It proves especially useful for: In choppy, sideways markets, MACD tends to create misleading signals since price has no real direction. MACD vs RSI: What’s the Difference? Both tools look at momentum, but they do it in separate ways. RSI pays attention to the strength of momentum and whether conditions have become overbought or oversold. MACD watches for shifts in momentum and signals that follow the trend. Many traders run both at the same time to get a clearer overall view. Why MACD is Important in Stock Market Learning MACD lets traders see momentum in a clear, organized manner. It shows how trends start building, lose speed, and sometimes turn the other way. This makes MACD a valuable piece of structured stock market learning, especially for people who want a deeper feel for how markets actually behave. Learn MACD with Practical Understanding Grasping the
RSI Indicator Explained with Strategy
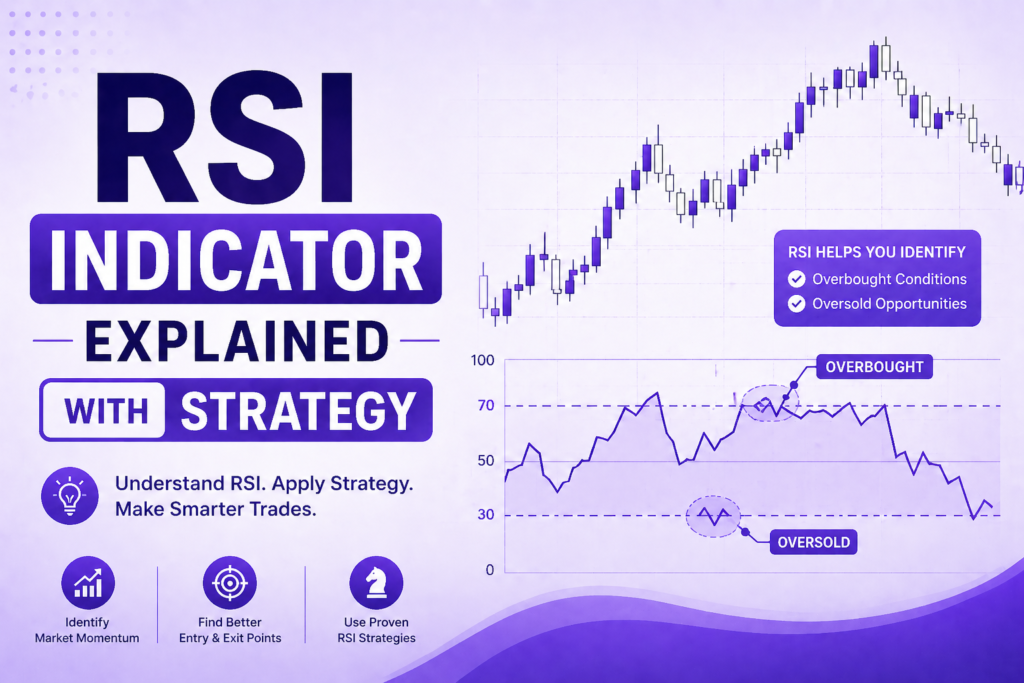
There are so many beginners who begin using indicators, hoping that they will give precise buy and sell signals. This anticipation tends to cause confusion and inconsistencies. Indicators are not predictive of the market; instead, they support decision-making by demonstrating underlying strength and momentum. One of the most popular indicators in trading is the RSI (Relative Strength Index). When interpreted properly, it helps traders identify momentum, strength, and potential reversal areas. Nonetheless, it may lead to poor decisions when applied out of context. This guide describes RSI in a well-organized, practical manner, enabling clear implementation in market conditions. What is RSI (Relative Strength Index)? RSI is a moving average indicator that quantifies the pace and magnitude of the recent price changes. It swings between 0 and 100 and assists traders to know whether a stock is overbought, oversold or neutral. The default RSI configuration is 14 periods and this works well in most timeframes. RSI would be better applied to know how strong or weak a move is as opposed to just looking at the levels. Understanding RSI Levels RSI only makes sense when you know how the various zones of RSI react to various market conditions. Overbought Zone (Above 70) An RSI above 70 indicates strong buying momentum. This, however, does not necessarily imply that the price will turn around. During powerful uptrends, RSI may remain above 70. Oversold Zone (Below 30) A RSI below 30 indicates good selling pressure. This does not necessarily mean that it will reverse immediately, as is the case with overbought conditions. When the market is in a strong downward trend, RSI might remain oversold longer than it should have. Neutral Zone (30–70) This is the area where most price movement occurs. RSI in this zone indicates normal market behavior and no extreme conditions. The Biggest Mistake Beginners Make with RSI One of the most frequent errors is to work with RSI as a direct signal: sell when RSI above 70, buy when below 30. This method pays little attention to the market context and is likely to result in losses. RSI is not meant to be used alone. To identify a Trend properly, always combine it with price structure and overall market direction for more accurate signals. How RSI Works in Real Trading RSI is efficient when applied alongside trend analysis. Traders ought to look at how RSI reacts to the broader market environment rather than the levels. RSI Strategy Based on Trend RSI in an Uptrend In an uptrend, the RSI typically remains above 40 and stays between 40 and 80. RSI is more likely to support itself in the 40–50 range than to enter the oversold zone. Under these circumstances, buying opportunities may arise on pullbacks to these levels, particularly when accompanied by price action. RSI in a Downtrend RSI tends to be in the lower 20s to 60s during a downtrend. It is hard to gain above 70, and it is frequently resistant in the 50-60 range. Rallies towards these levels can offer selling opportunities, in this case, when the price is weak. RSI Divergence Strategy Divergence is among the most valuable RSI concepts, as it indicates a possible change in momentum. Bullish Divergence This happens when price makes a lower low, whereas RSI makes a higher low. It indicates that the selling pressure is decreasing and a possible upward movement can happen. Bearish Divergence This happens when the price is high, but the RSI produces a lower high. It shows that the momentum of buying is declining and it can go downwards. It is noteworthy that divergence is one of the early indicators, and it should always be verified by price action. Combining RSI with Support and Resistance RSI is much more effective when used with significant price levels. To illustrate, when the price nears a solid support zone, and the RSI is in the oversold area, chances are that the price will rebound. Equally, when the price approaches resistance and the RSI is overbought, this reinforces the argument that a rejection could occur. This combination enhances decision-making by providing context for RSI signals. Step-by-Step Approach to Using RSI An organized strategy will prevent confusion and enhance consistency: This approach will mean RSI will assist you in making decisions, not dictate them. Common Mistakes While Using RSI RSI may be abused even by the most experienced traders unless they pay attention to context. Common mistakes include: These errors can be avoided and this greatly enhances accuracy and consistency. Why RSI is Important in Stock Market Learning RSI helps traders understand momentum, one of the essential elements of market behavior. It makes the complicated price movements simpler and gives an understanding of strength and weakness. This makes RSI a vital aspect of organized Stock Market Learning, particularly for beginners establishing their footing. Learn RSI Strategy with Practical Understanding The conceptual understanding of RSI is straightforward, yet using it effectively in practical markets requires guidance and experience. Founded by SEBI Registered Stock Market Analyst Bharath Shankar, Aceink is a company that specializes in practical learning with their Free Stock Market Webinar. During this session, traders will understand RSI’s behavior under real-world conditions, the pitfalls to avoid, and how to effectively combine it with price action. This strategy helps close the theory and practice gap. Conclusion RSI is an effective tool that can be used with good sense and discipline. It is an excellent indicator of the market momentum, but must be combined with trend and structure. RSI, when used properly, can be a useful tool to enhance trade timing and decision-making. Aceink assists traders in building such understanding through its Free Stock Market Webinar, where ideas are taught using real-market examples and structured learning.
Trendlines Explained with Real Examples
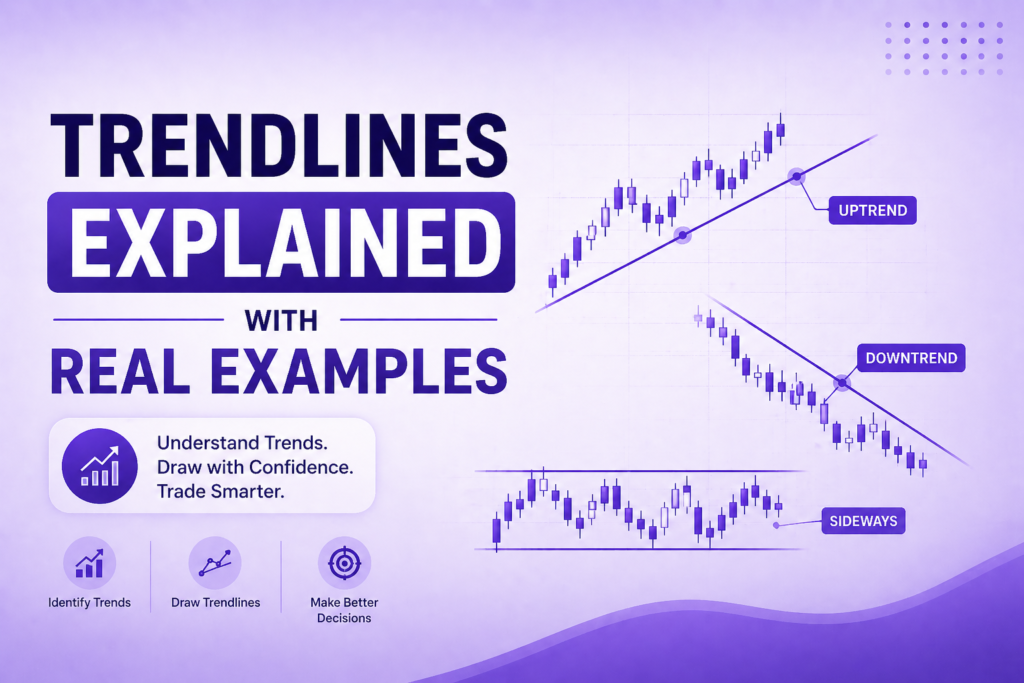
The majority of new traders believe that trendlines are lines on a graph. However, in fact they are much more, the structure and behavior of the market. Trendlines will make you know where price should respond, when it is moving with strong momentum, and when it will change when used properly. It is not a matter of line-drawing. It has to do with reading the market. We will deconstruct trendlines in a real-world trading manner. What are Trendlines in Stock Market? Trendlines are straight lines that are drawn on a chart to match crucial price points and the way the market is moving. They allow you to be able to see in an organized direction how price is going or losing strength. Trendlines unlike the static levels follow the price. Hence, they are referred to as dynamic support and resistance. Simply put, trendlines indicate the way in which buyers and sellers are acting through time. Types of Trendlines You must be familiar with the behavior of the trendlines in various market conditions before you make use of them. Uptrend Trendline (Dynamic Support) Higher lows are connected to draw an uptrend trendline. This line serves as a support and where the price tends to get buying support and keep on moving up. Price should never cross this line, since as long as it does, the uptrend will be valid. Downtrend Trendline (Dynamic Resistance) The downward trendline is a line that is used to connect lower highs. This one is resistance at which selling pressure is heightened. Consistent decline proves the power of downslope. Step-by-Step Process to Draw Trendlines To make trendlines right is more significant than to be familiar with them. The majority of errors occur at this point. Identify Clear Price Swings Identify high and low points on the graph. Trendlines are not arbitrary movements, but must have significant points. Connect Minimum Two to Three Touchpoints A valid trendline must be verified. The more the touchpoints the stronger and reliable the trendline. Avoid Forcing the Line The line must move in line with price movement. When you have to change too much, it means that the structure is probably weak. Use Higher Timeframe for Accuracy Lower timeframes are less reliable than trendlines that are drawn on daily charts. The extended timeline has clearer format and format. Real Example of Uptrend Trendline We will learn how to do this in practice. Consider a stock that is steadily increasing. It takes off high, then retreats and then a high tone again. This pattern continues. The pullback points will give an upward sloping trendline when you connect them. And now view the action of price: Whenever it moves towards this line, customers intervene and drive the price up. This demonstrates a high demand and organized flow. This is used by traders to: Real Example of Downtrend Trendline Now imagine a stock that is decreasing. Falls in price, then withdraws, repeats but does not go up and declines again. This forms low highs. The links of these rejection points create a downward trend line. Every time the price approaches this line, the level of selling pressure rises. This indicates weakness and continuation of downtrend This is used by traders to: What Happens When Trendline Breaks A trend line break indicates shift in momentum, not necessarily reversal. It is here that the beginners become confused. Following a hiatus, price can: Break is not sufficient. Confirmation is important Common Mistakes Beginners Make Even such simple ideas like trendlines can be mistaken unless they are used appropriately. Such errors cause disorder and wrong decisions. How to Use Trendlines in Real Trading Trendlines do not only serve to analyze. They are involved in the real decision making. This gives order to your trades. Why Trendlines are Important in Stock Market Learning One of the initial tools which assist traders to move out of confusion to clarity is trendlines. They teach you: This is why they are an important element of Stock Market Learning and basic concepts of trading. Learn Trendlines in Free Stock Market Webinar It is not difficult to grasp the concept of trendlines. Most traders have difficulty in applying them in live markets. Aceink is a practical based learning firm that deals with Free Stock Market Webinar, led by the SEBI Registered Stock Market Analyst of Bharath Shankar. During this session, you will learn: This will assist you to acquire actual confidence in chart reading. Conclusion Trendlines are simple, but powerful when used correctly. They can make you aware of where price is likely to respond and the structure of the market. Together with discipline and appropriate analysis, they would be a potent instrument of improved decision-making. Aceink can enable you to master this with its Stock Market Free Workshop that you can learn how to apply the trendlines in the actual market conditions. Cease speculation about the market. Begin to read it distinctly.
Moving Averages Strategy (20/50/200)
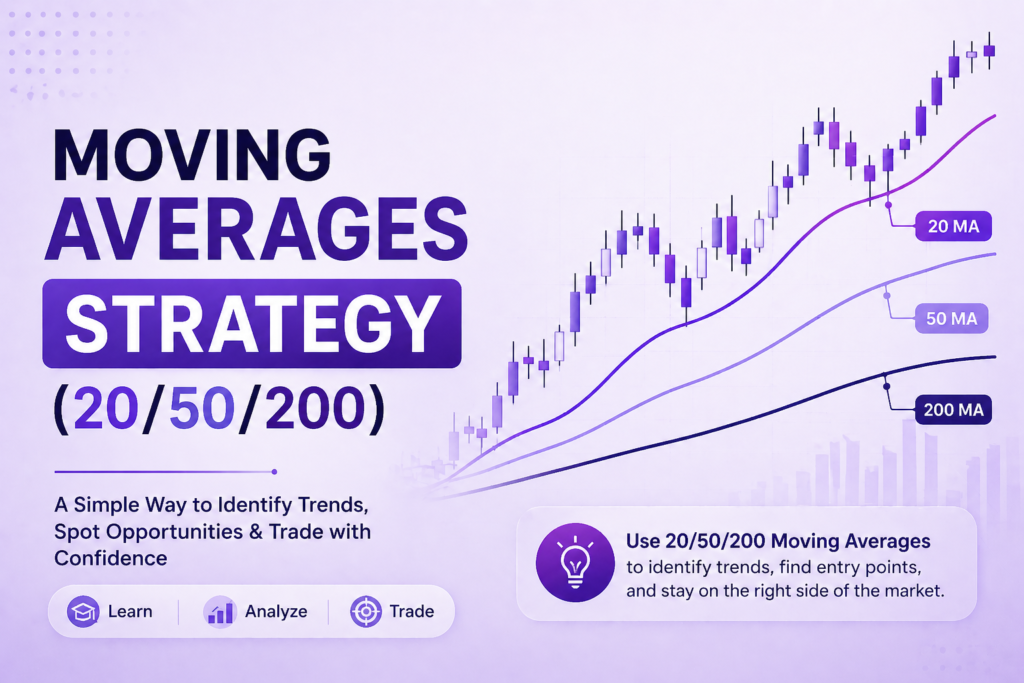
The majority of beginners seek advanced tactics, believing that more indicators equal higher accuracy. However, in practice, simple, well-understood tools can make some of the best trading decisions. The most effective of them is the Moving Average strategy, namely the 20-, 50-, and 200-day moving averages. These are not lines on a chart. They are trends, momentum and market behavior. When properly applied, they help you filter noise and make structured decisions. What are Moving Averages? A moving average is a graph showing the average price of a stock over a given period. For example: The average is moving, as the price is changing, hence the name, a moving average. It smooths price action and helps identify the underlying trend. Why 20, 50, and 200 Moving Averages Matter The reason these three are popularly utilized is due to the fact that they depict an alternative view of the market. All of them provide a complete picture of the market structure. This mix assists merchants to work in tandem with the greater picture rather than responding to minor changes. Understanding Each Moving Average 20 Moving Average (Fast Line) The 20 MA responds rapidly to any change of price. It is useful for: Staying above price 20 MA implies a short-term strength. 50 Moving Average (Balance Line) The 50 MA offers a more stable and less rugged look. It is commonly used to: It is a dynamic support or resistance to trending markets. 200 Moving Average (Major Trend Line). The long-term trend is the 200 MA. Institutions are numerous followers of it. Above 200 MA – Long-term bullish. Price lower than 200 MA: Long-bearish. Overall market bias is defined by this line. The 20-50-200 Moving Average Strategy The method is effective as it involves a combination of all three moving averages to gain an insight into trend alignment. Rather than you are monitoring a single signal, you are monitoring how these lines are interacting with each other and price. Bullish Setup An excellent bullish pattern takes the form of the following: This alignment shows: Under these circumstances, traders seek a purchase on pullbacks. Bearish Setup A bearish formation appears as following: This indicates: Traders specialise in selling chances or shunnings. Golden Cross and Death Cross These are popular market indicators. Golden Cross On passing 50 MA over 200 MA. Indicates possible long term positive trends. Death Cross When 50 MA goes below 200 MA Portends positional to weakness. How to Use Moving Averages in Real Trading Moving averages are not independent signals. They are used effectively in combination with structure. Entry Strategy Exit Strategy Get out when the price falls below a significant moving average. Or in cases of diminished trend structure. Stop-Loss Placement This aids in risk management. Common Mistakes Beginners Make Even tools that are simple can break when they are not used properly. These errors lessen efficiency. When Moving Averages Don’t Work Moving averages have problems in: Signals are not reliable in such situations. This is the reason why context is important. Why Moving Averages are Important in Stock Market Learning Moving averages assist novices: They serve as a guide in Stock Market Learning since they make sophisticated price action easier. Learn Moving Averages the Right Way It is easy to understand moving averages in theory. Most traders have difficulties when applying them in live markets. Aceink, headed by SEBI-registered stock market analyst Bharath Shankar, is committed to imparting practical knowledge through the Free Stock Market Webinar. During this session, you will learn: This will assist you in moving out of confusion to clarity. Conclusion The moving averages of 20, 50, and 200 are easy-to-use, powerful tools. They help you in comprehending trends, momentum, and construction without overbearing charts. When utilized in an orderly and correct context, they are a powerful segment of your trading system. Aceink will assist you in perfecting these, and in the process you will understand how to use moving averages in real market situations at its Stock Market Free Workshop.
Breakout vs Fakeout: How to Avoid Traps
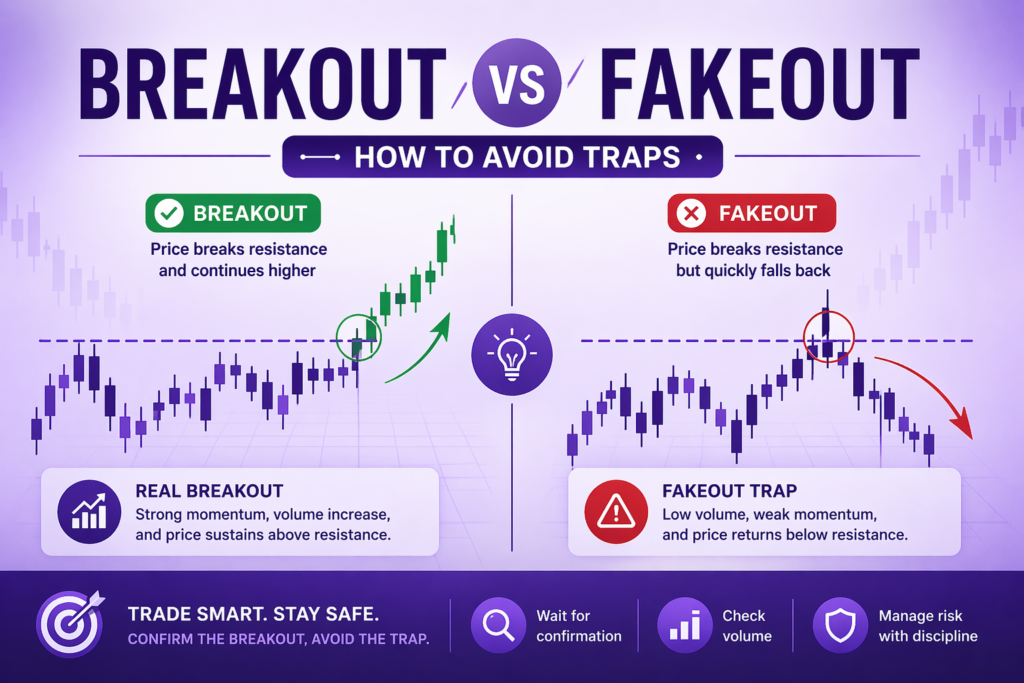
You wait patiently. You indicate a high resistance. Price then breaks above it, and you go into the trade hoping for a good move. Only to be reversed in a brief period and to find yourself at a loss. It is not a misfortune. It is a fake out, one of the most prevalent trading traps. Here’s the reality: The market does not move on its own. It trails, detects, and sieves participants. It is crucial to realize the difference between a legitimate breakout and a fakeout so that you can trade clearly rather than confusingly. What is a Breakout? A breakout occurs when the price goes past a significant level and maintains that position. Not only is it about passing a stage. It is on acceptance on a higher level. A good breakout tends to exhibit three attributes: This implies that either buyers or sellers are dominating, and the market is willing to go in that direction. What is a Fakeout? When a price breaks a level and does not follow through but instead turns around soon, it is a fakeout. It appears to be a legit breakout at first sight. At that stage, a good number of traders come in. However, rather than continuation, there is an opposite movement of the market. This is a trap. Fakeouts are usually done due to: The consequence is the same, that is, confusion to the newcomers and losses to the unpunished traders. Key Difference Between Breakout and Fakeout Breakout and fakeout appear to be identical at first sight. Price breaks a major level, momentum builds, and it feels like the move has begun. And the actual difference is not the breakout itself; it is the market’s behavior after the breakout occurs. Therein the clearness lies. Price Acceptance vs Price Rejection An actual breakout depicts acceptance. Price goes past the level and remains above or below. Rejection is represented by a fakeout. Price rises above the level but soon returns, signaling no strength. Continuation vs Reversal Behavior In a true breakout, the market moves and keeps moving in a similar direction and there is a follow-through. During a fakeout, the market turns around shortly after the breakout and usually catches off traders who made the early entry. Strong Momentum vs Weak Movement Strong price movement is typically in favor of breakouts and bears clear intentions of buyers or sellers. Fakeouts are not always so strong. The transition seems feeble, wobbly, and unsustainable. Structure Alignment vs Market Noise An actual breakout is in line with the general market structure and the direction of the trend. In uncertain or lateral conditions, where price movement is not directional, a fakeout typically occurs. Confidence vs Confusion A real explosion makes sense. Pricing is presented more easily, and decisions are formal. A fakeout leaves an impression. Price volatility causes emotional, reactive trading. Why Most Traders Get Trapped? Most traders do not lose because they are unaware of breakouts. They fail as they go too directly with no confirmation, structure, or discipline. Entering Trades Without Waiting for Proper Confirmation Signals Countless traders come in immediately when the price breaks a level, even before they can determine whether the market accepts the breakout. Ignoring the Overall Market Trend and Trading Against Direction Breakout trades made without trend-checking result in low-probability setups, particularly when the overall market is trending against the setup. Trading in Sideways Markets Where Breakouts Often Fail With range-bound conditions, the price often breaks levels in the short term and then backtracks; thus, breakout trading is ineffective, and the probability of a trap is high. Overtrading and Chasing Every Visible Breakout Opportunity Attempting to trade all breakouts leads to poor decision-making; not all of these setups are valid or worth trading in a real market environment. Lack of Risk Management and No Defined Exit Strategy In the absence of appropriate stop-losses and planning, traders have to keep losing positions open longer, turning small errors into bigger losses on fakeouts. Emotional Decisions Driven by Fear of Missing Out FOMO compels traders to make hasty entries without analysis, making them easy targets for fakeouts on abrupt, deceptive price changes. How to Identify a Strong Breakout A powerful breakout does not simply concern the price crossing a level. It is of power, affirmation, and ongoing motion above all. How to Avoid Fakeouts? This is not about avoiding fakeouts due to market predictions. It is concerning the better decision-making process. These are important principles that can be used: Such minimal adjustments in strategy can make a big difference in your consistency. Why This Concept is Important in Stock Market Learning The concept of breakouts and fakeouts does not revolve around a single tactic. It deals with knowing how the market reacts around critical levels. This concept improves: It also assists you in shunning emotional trading which is the major cause of losses. This is why it is a fundamental component of systematic Stock Market Learning. Learn Breakout Trading the Right Way It is one thing to read about breakouts. It is one thing to understand them in practice in the marketplace. Aceink, led by SEBI-registered stock market analyst Bharath Shankar, is dedicated to helping beginners and investors in exploring the key differences between breakouts and fakeouts in the stock market in his Free Stock Market Webinar held every Sunday. During this session, you get to know how to: This will help you become more confident when you are in a state of confusion. Conclusion Breakouts are good, whereas fakeouts are bad. The distinction between the two has been in how you read the market and how patiently you take action. Your trading naturally improves as you stop reacting to each move and wait for confirmation. Aceink can help you achieve clarity through its Stock Market Free Workshop, where you learn how to deal with real market situations in a disciplined, structured manner.
How to Identify a Trend: Uptrend, Downtrend, Sideways?

Most beginners do not lose money because they choose the wrong stocks. They fail because they are unaware of the market direction. They purchase during down periods, sell during up periods, and experience stagnation in the sideways markets. The truth is this, however: When you can spot the trend in the proper way, half the trouble of trading is already gone. The basis of trading is the trend. In its absence, all decisions would be guesswork. We can take a closer look at how to recognize the right trends, as real traders do. What is the trend in Stock Market? A trend merely shows how the market is progressing. The number of possibilities is only three: Each stock, each index, must always be either of these types. It is not your responsibility to forecast the market. It is your task to find out what it is doing at present. This is what Stock Market Learning is all about. Types of Trends in the Stock Market You should be clear about what each trend really looks like in real market conditions before identification. 1. Uptrend (Higher Highs, Higher Lows) When the price is always increasing, then this is an uptrend. How to Identify: What It Means: Strategy: Concentrate on acquisition opportunities. Novice Error: Attempting to sell due to a feeling of high price. 2. Downtrend (Lower Highs, Lower Lows) A downward trend is when the price is moving consistently lower. How to Identify: What It Means: Beginner Mistake: Purchasing all the dips without verification. 3. Sideways Market (Range-Bound) Herein lies the bane of the amateurs. How to Identify: What It Means: Strategy: Do not overtrade or trade cautiously. Novice Trap: False breakouts. Step-by-Step Process to Identify Trend Read market direction easily by following a simple process. Start with a Higher Timeframe for Clarity Always start with a longer time frame, such as daily charts, to filter out the noise and get a clear picture of the overall direction the market is moving before looking at smaller movements. Observe Price Structure Carefully Pay attention to the price trend. Determine which trend direction it is, whether higher highs, lower lows, or making highs within a range. Mark Key Support and Resistance Zones Mark significant levels at which the price responds consistently. The zones assist in either proving that the market is moving or merely moving within a range in the same direction. Align Trend with Market Behavior Determine whether the price is honoring the trend determined. Regular motion towards the same direction determines strength, and frequent irregular motion tends to indicate a sideways state. Wait for Confirmation Before Acting Trades are not to be hastened into. A good way to determine where to stay in the market is to wait till you get a clear confirmation such as breakout, pullback or continuation. Common Mistakes While Identifying Trend The novices commit the following errors even after learning the basics: These errors result in incorrect entries and losses. How to Improve Trend Identification To improve, work on processes not shortcuts. The identification of trends is enhanced through observation and experience. Why Proper Stock Market Learning Matters Theoretically trend identification is easy, however the real markets behave otherwise. Charts are not necessarily clean. Signals do not necessarily stand out. In this, structured Stock Market Learning comes into play. Instead of guessing, you learn: Learn Trend Identification in Free Stock Market Webinar To know trends right, you must have more than theory; you must have market understanding. Aceink, headed by SEBI-registered stock market analyst Bharath Shankar, conducts the Free Stock Market Webinar, helping you completely understand the concept of trends, including Uptrend, Downtrend, and Sideways. During this lesson, you will study: Conclusion Knowing trends is not merely a theory; it is a fundamental trading practice that will distinguish between an unplanned move and a planned action. Once you learn how to read the market direction properly, you become more confident and diminish the number of errors. But guided practical learning offers real clarity. Led by SEBI-registered stock market analyst Bharath Shankar, Aceink helps you understand developments in real market scenarios through its Free Stock Market Webinar. You are not confused but rather gain a step-by-step understanding of how markets move and how to match your trades to them. This is where you want to start, willing to learn the Stock Market.